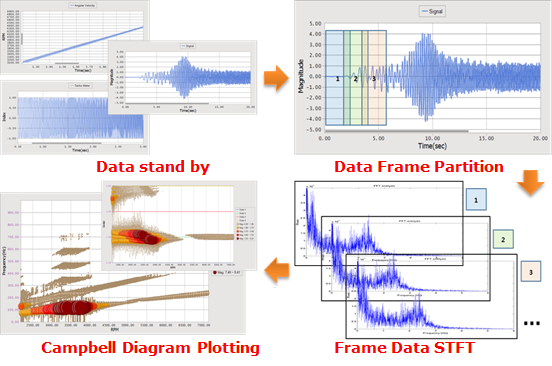
There are three steps to create a transient Campbell diagram. The first step is partitioning the data. In this step, you must partition the data against time into a certain number of data frames, each of which becomes a single piece of signal data. During this process, the data in sequential frames may overlap during partitioning. The RPM data is also partitioned using the same signal data against time and the same frames. The second step is to use the FFT algorithm to convert the signal data, which has been partitioned and generated, into a frequency. During this step, you can extract an interaction graph of the frequency and amplitude and define a representative RPM value for each frame. For this, you can use the root mean square (RMS) value or the universal average of each frame. Finally, you can use the FFT data, which is calculated for each frame, and the RPM information to produce a 3D plot.
Figure 1 Overview of the transient Campbell diagram process