There are many ways to plot the Campbell diagrams, but the Waterfall diagrams are the most popular for the rotor systems. This type of diagram expresses the FFT data in a 3D space. Each point in the 3D space is mapped based on the RPM, frequency, and amplitude values inputted into the algorithm. Some Waterfall diagrams express amplitude through the size of each point in a 2D graph (RPM - Frequency). The user can also use the constant band method or the constant ratio method to draw the Waterfall diagrams.
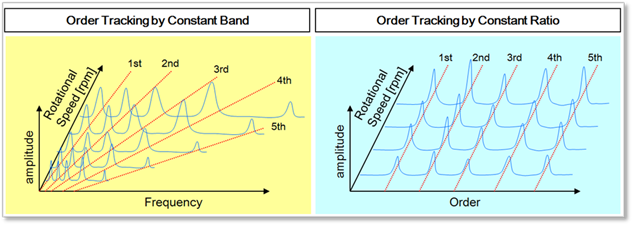
•Order tracking by constant band: Draws the diagram based on the rotational speed and frequency.
•Order tracking by constant ratio: Draws the diagram based on the rotational speed and order.