
1. Create or Open a Crank Model.
2. Check the Control of Constant Mean Angular Velocity in the Crank System Component Builder dialog box of the Crank toolkit and click OK. Then, the CCMAV force is created in the Database window.
3. For setting the initial condition by double clicking the CCMAV force or pushing Input in the Crank System Component Builder dialog box.
4. Set the user-defined parameters by clicking Input.
Figure 1 CCMAV
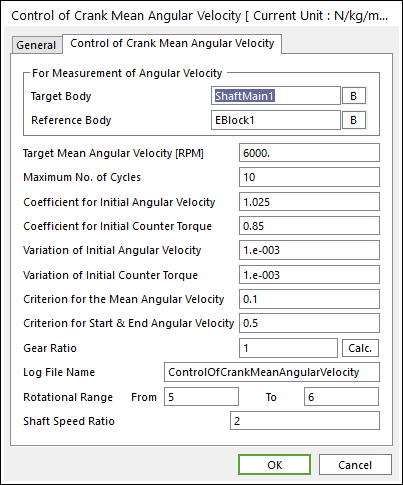
Figure 2 CCMAV setting dialog
To see more information about the Control of Crank Mean Angular Velocity dialog box, refer to Modification of property.
•When creating the CCMAV force, the parametric values are created for the setting values at the same time.
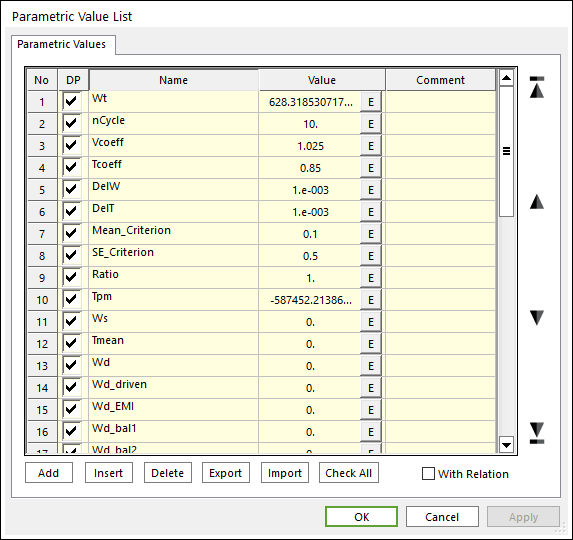
Figure 3 Parametric Value List dialog box after creating CCMAV force
For more information about parametric values, refer to Parametric Value List about CCMAV.
5. Run the simulation by clicking CCMAV
Figure 4 CCMAV
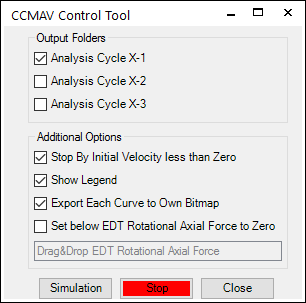
Figure 5 CCMAV Control Tool dialog box
•Output Folders: Remains the output folder option
•Analysis Cycle X-1: Remains the first analysis output data. If the user does not check this option, the first analysis output data is automatically removed.
•Analysis Cycle X-2: Remains the second analysis output data. If the user does not check this option, the second analysis output data is automatically removed.
•Analysis Cycle X-3: Remains the third analysis output data. If the user does not check this option, the third analysis output data is automatically removed.
•Addition Options
•Stop By Initial Velocity less than Zero: An analysis is stopped when the initial angular velocity of the crank shaft is less than zero.
•Show Legend: Shows the legend plot data in the post process.
•Export Each Curve to Own Bitmap: Exports each curve plot data to own bitmap image file.
•Simulation: Starts a simulation
•Stop: Stops the simulation
6. Draw results in Plot automatically and create the output data after finishing the simulation.
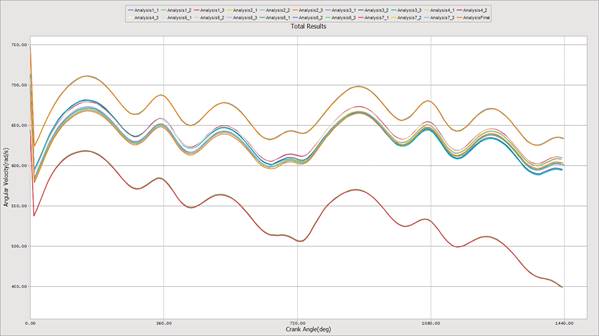
Figure 6 Result All Results Plot data
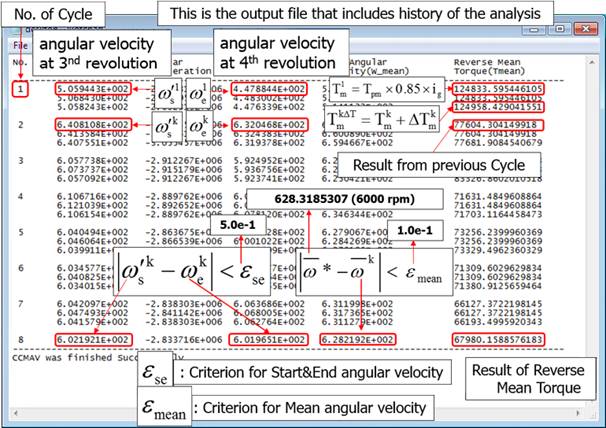
Figure 7 Output data in the *.log file
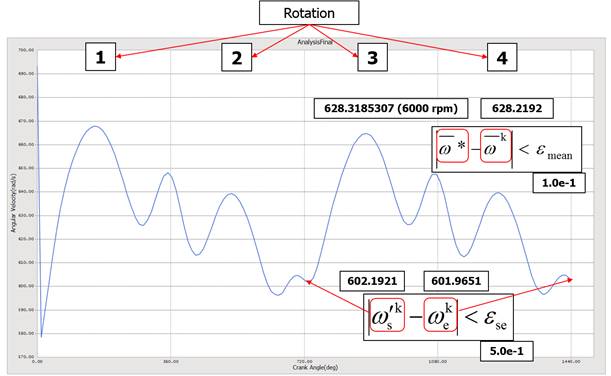
Figure 8 Final Result data in Plot
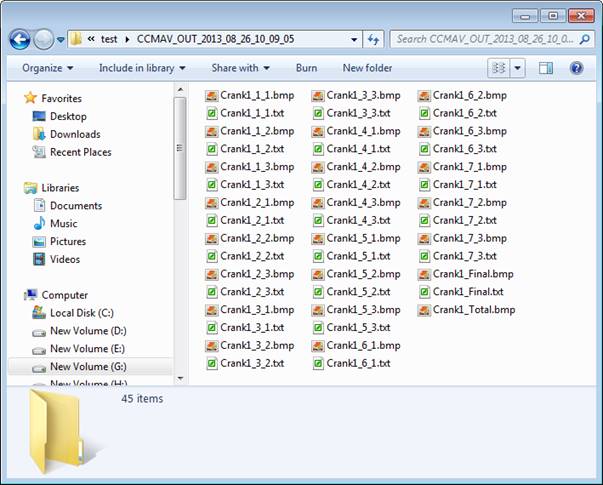
Figure 9 Output Curve data and Bitmap images (if Export Each Curve to Own Bitmap option is checked, it can be there)
7. The initial velocity and the count torque gotten from the results of CCMAV are applied to the model.
•If the user sees the parametric value after completing the simulation, the value gotten from the last analysis is set.
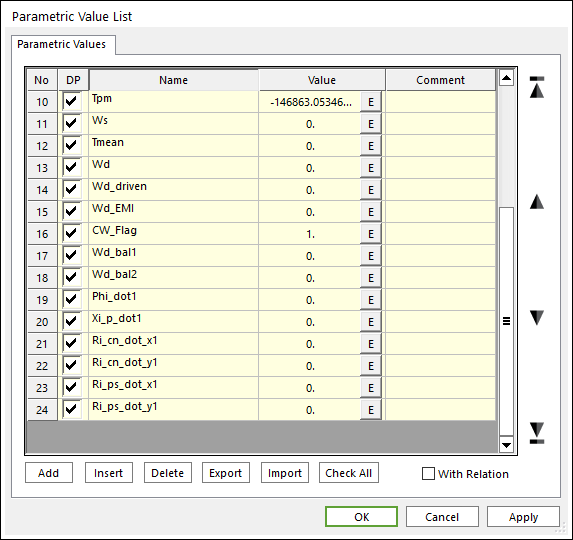
Figure 10 Parametric Value List dialog box after simulating
•Remove the CCMAV force in the Database window and then input PV: Tmean in Counter Torque Force of the properties of EDT dialog box. If the user does not remove the CCMAV force, the analysis is stopped when passing the rotational range.
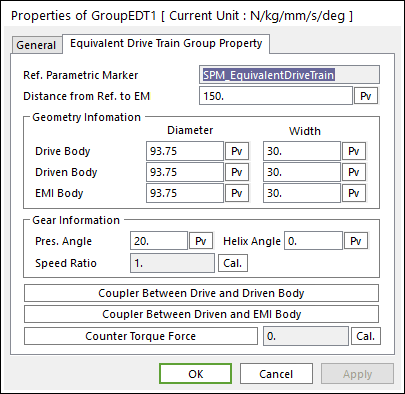
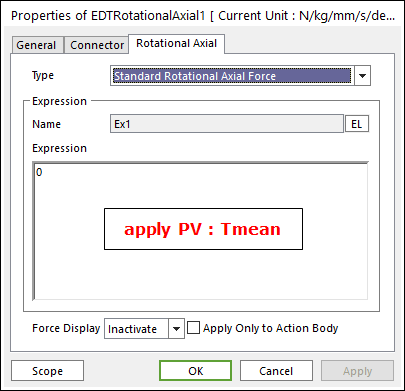
Figure 11 EDT group dialog box