As a final discussion, let’s consider the method of estimating the what-if effect that some change in problem parameters such as mean and standard deviation values has on the most probable failure point (MPP). Suppose that the mean value of loads or the standard deviations of random design variables are changed after we have already found an MPFP. Then, we want to estimate the effect that this will have on the reliability analysis without actually solving the reliability analysis problem over again.
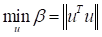
Reconsider the following reliability analysis formulation described in First-Order Reliability Method (FORM).
subject to

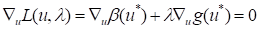
This problem is an optimization problem. Thus, an optimum
 should satisfy the
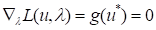
following Kuhn-Tucker optimality conditions.
should satisfy the
following Kuhn-Tucker optimality conditions.
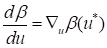
Now, the variation form of the objective is
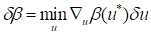
Then, the design sensitivity values of Reliability Index can be represented as
Finally, in order to satisfy the Kuhn-Tucker optimality conditions, it can be simplified as
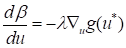
where Lagrange multiplier can be determined as
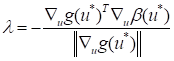
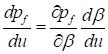
from the optimality conditions. The design sensitivity for the failure property can be determined as
Let’s reconsider the example explained in Example for Normal Distributions. The reliability analysis was performed at mean values (10, 10) and standard deviations (5, 5). If the mean values are increased, then is the reliability index increased or decreased? Or if the standard deviations are decreased, is the failure probability decreased or increased?
We can know this information from design sensitivity analysis. AutoReliability provides the analytical design sensitivity results. Table 1 lists the design sensitivity results.
|
|
AFORM |
AFORM+DRM2 |
|
|
0.1414 |
0.1280 |
|
|
0.1414 |
0.1280 |
|
|
-0.2240 |
-0.2028 |
|
|
-0.2240 |
-0.2028 |
|
|
-0.004589 |
-0.002397 |
|
|
-0.004589 |
-0.002397 |
|
|
0.007270 |
0.003798 |
|
|
0.007270 |
0.003798 |
Table 1 Design sensitivity results
In the above table, ‘AFORM’ and ‘AFORM+DRM2’
give same signs but different values of design sensitivity. Why? It is because
they give different reliability index values( ). Thus, AutoReliability modifies
the design sensitivity values to the degree of difference of reliability index
value.
). Thus, AutoReliability modifies
the design sensitivity values to the degree of difference of reliability index
value.
From the design sensitivity analysis results, we can know that the failure probability can be decreased when two mean values are increased. If the standard deviations are increased, the failure probability can be increased.
This information can be verified from the figure. When two mean values are increased, the current point is moved away from MPP. This represents that the current point is moved into safer region.
Next, consider the Monte Carlo simulation. If the standard deviations are increased, the sample points are more scattered from the current point. Thus, the number of failure points can be increased. Thus, the failure probability can be increased.
Reference
1. Achintya Haldar and Sankaran Mahadevan, Probability, Reliability, and Statistical Methods in Engineering Design, John Wiley & Sons, Inc., New York, 2000.
2. Singiresu S. Rao, Reliability-Based Design, McGraw-Hill, Inc., New York, 1992.
3. Hasofer, A.M. and Lind, N.C., “Exact and invariant second-moment code format”, J. Engng. Mech. Div. ASCE, 100(EMI), pp. 111-121, 1974.
4. Rackwitz, R. and Fiessler, B., “Structural reliability under combined load sequence”, Comput. Struct., Vol. 9, pp. 489-494, 1978.
5. Wang, L. and Grandhi, R.V., “Effivient Safety Index Calculation for Structural Reliability Analysis”, Computer & Structures Vol. 52, No. 1, pp. 103-111, 1994.
6. Der Kiureghian, A. and Dakessian, T., “Multiple design points in first and second-order reliability”, Structural Safety, Vol. 20, No. 1, pp.37-49, 1998.
7. Breitung, K., “Asymptotic Approximations for Multinormal Integrals”, Journal of Engineering Mechanics, ASCE, Vol. 110, No. 3, pp. 357-366, 1984
8. Wei, D. and Rahman, S., D.,”Structural reliability analysis by univariate decomposition and numerical integration”, Probabilistic Engineering Mechanics, Vol. 22, pp. 27-38, 2007.
9. Rahman, S. and Xu, H., “A univariate dimension-reduction method for multi-dimensional integration in stochastic mechanics”, Probabilistic Engineering Mechanics, Vol. 19, pp. 394-408, 2004.
10. Rahman, S. and Wei, D.,”A univariate approximation at most probable point for higher-order reliability analysis”, Int. J. of Solids and Structures, Vol. 43, pp. 2820-2839, 2006.
11. Min-Soo Kim, User’s Guide for PV-INOPL: Meta-Model based Reliability Index Analysis, Institute of Design Optimization Inc., Korea, 2009.


