1. Click the Spline icon and then the Spline List dialog box appears as follows.
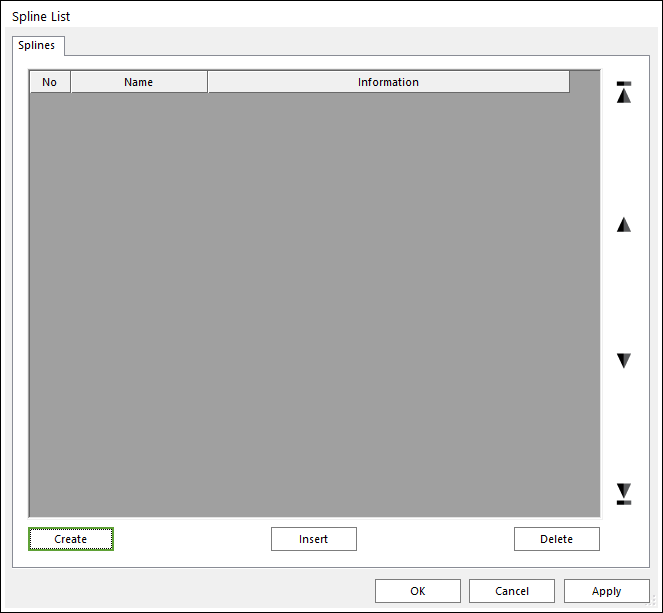
Figure 1 Spline List dialog box
•No: Shows the number of spline.
•Name: Shows the name of spline.
•Information: Shows the number of row about the defined data.
•Create: Creates a spline.
•Insert: Inserts a spline at the current cursor row.
•Delete: Deletes a spline at the current cursor row.
2. Click Create or Insert, and then the Spline dialog box appears.
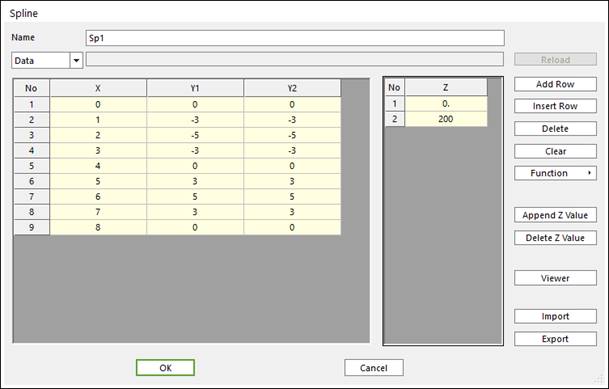
Figure 2 Spline dialog box
•Add Row: Adds a pair of data
•Insert Row: Inserts a pair of data
•Delete: Deletes a pair of data
•Clear: Deletes all data of all rows.
•Function: Creates a linear line data by inputting Slope and absolute Value. If the user inputs 10, the number of data is 11.
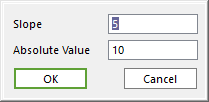
Figure 3 Function dialog box
•Slope: Input value of slope for linear line.
•Absolute Value: if the user inputs 10, x values are between -10 to 10.
•Append Z Value: Append Z data. It is used to create a 3D Spline and Y data (Y1, Y2… Column) is added automatically.
•Delete Z Value: Deletes Z data.
•Draw: Draw the spline data. Refer to Using Spline Viewer dialog.
•Import: Import the spline data.
•Export: Export the spline data.
•Supported formats are the CSV File(*.csv), Text File(*.txt) and the Matrix Data File(*.mat).
3. Click Add.
4. Specify Name and the spline data by x and y coordinates in the Spline dialog box.
5. Click OK.