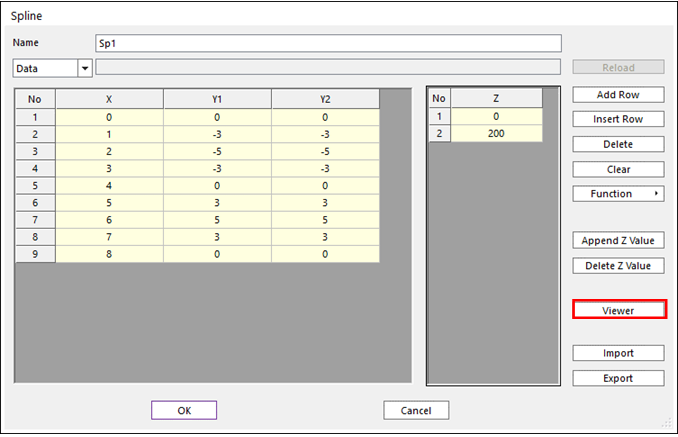
To see the spline shape, click Draw. The user can preview a spline curve and set additional options.
Figure 1 Spline dialog box

Figure 2 Spline Viewer dialog box
View
These options do not affect the simulation results, just view only.
•2D/3D: Select 2D or 3D view.
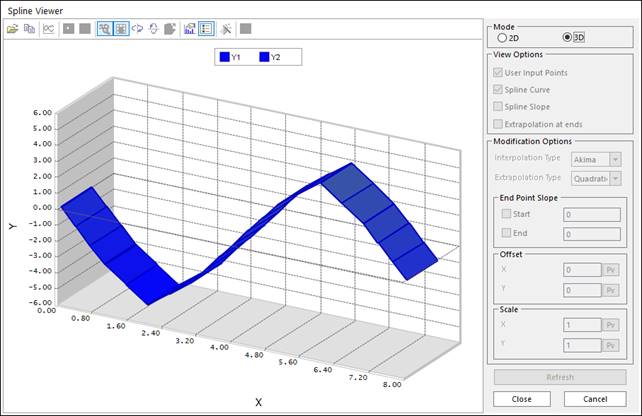
Figure 3 Spline Viewer (3D) dialog box
•Chart option: refer to Chart Properties
•User Input Points: Displays a symbol of spline data
•Spline Curve: Displays a spline curve, this spline curve is determined by “Interpoation Type” in “Modification Options”.
•Spline Slope: Displays a derivative curve of “Spline Curve”
•Extrapolation at ends: Displays an extrapolation tail of spline curve
Options
These options affect the simulation results. The user can preview a spline curve before a simulation.
•Interpolation Type: This option determines the interpolation type of the spline curve. If you use this spline curve to a contact or force, the selected “Interpolation Type” is applied to “Spline” of that contact or force entity. (Caution: If you use “AKISPL”, “CUBSPL”, “LINSPL” in expression, the selected “Interpolation Type“ is not working, because name is the interpolation type.)
•Akima: Make spline curve by using akima spline interpolation.
•Linear: Make spline curve by using linear interpolation.
•Extrapolation Type: Linear, Cubic or Quadratic
•Linear: Makes extra data to linear line as the slope of last point.
•Cubic: Makes extra data to spline curve.
•Quadratic: Makes extra data to 2-order polynomial curve.
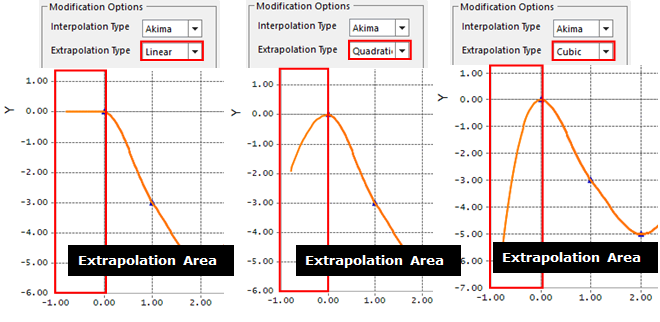
Figure 3 Applied Extrapolation option
•Slope: Slope of begin point and end point
•Begin: Defines the slope of begin point.
•End: Defines the slope of end point.
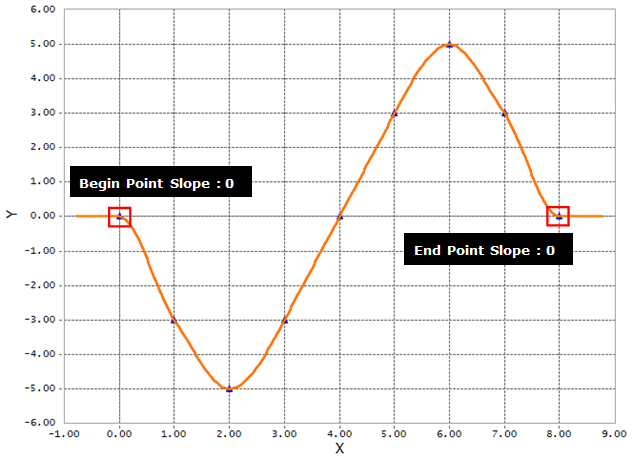
Figure 4 Applied Slope option
•Offset: The X offset, and Y offset factors translate the given data (x-data, y-data) to be (X-Offset + x-data) and (Y-Offset + y-data). For example, if the y-data is given to be 0 in the first column of a spline and the Y-offset is 10, the x-data in the solver is recognized as 10.
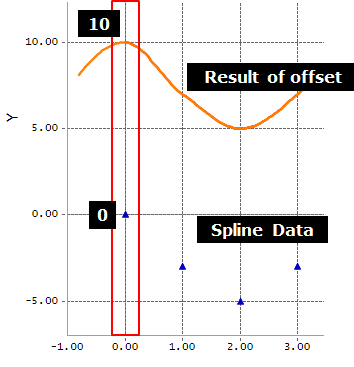
Figure 5 Applied Offset option
•Scale: The X and Y factors adjusts the scale in order that the given Data (x-data, y-data) is X-Scale*given x-data and Y-Scale*given y-data. For example, if the y-data is given to be -5 in the first column of a spline and the Y-scale is 2, the y-data in the solver is recognized as -10.
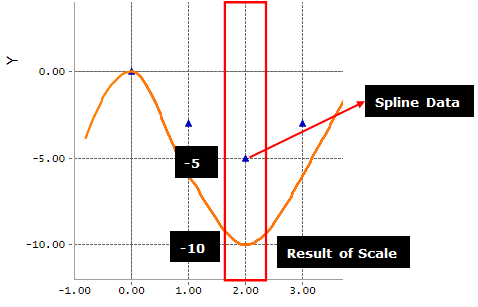
Figure 6 Applied Scale option
•Refresh: Redraws a curve when options are changed
Note
The options are applied as following order:
Offset à Scale à Slope