 is linear in the two basic variables
 and
and .
.
Consider the following example in which  is linear in the two basic variables
 and
and .
.

In which here  is Weibull distribution and
 is the maximum
distribution of extreme value. Their mean and standard deviation values are
(20,10) and (3,3), respectively.
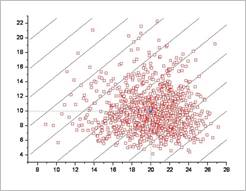
Sol: Figure 1 shows the result of Monte Carlo simulation with 1000 latin hypercube samples. The probability of failure is estimated as 0.021. As you can see, the distribution of sample points is quite different from those shown in the figure.

Figure 1 Monte Carlo simulation for Weibull and EVD-I max distributions
Next, let’s compare the sample point distributions by
changing the statistical distribution. Suppose that  is normal distribution for the
above problem. For fair comparisons, the same random points between 0 and 1 are
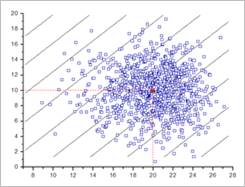
used. Figure 2 shows the real sample points. If we cut the distribution at
  , the sample points are nearly
symmetric distributions along
  axis. The vertical axis is
  . As the statistical distribution
is changed, the probability of failure is changed as 0.011.

Figure 2 Monte Carlo simulation for Weibull and Normal distributions
Reference
1. Achintya Haldar and Sankaran Mahadevan, Probability, Reliability, and Statistical Methods in Engineering Design, John Wiley & Sons, Inc., New York, 2000.
2. Singiresu S. Rao, Reliability-Based Design, McGraw-Hill, Inc., New York, 1992.
3. Harbitz, A., “An Efficient Sampling Method for Probability of Failure Calculation, ”Structural Safety, Vol. 3, pp. 109-115, 1986.
4. Ang, A.H.-S., and Tang, W.H., Probability Concepts in Engineering Planning and Design, Volume II: Decision, Risk, and Reliability, John Wiley & Sons, Inc., New York, 1984.
5. Wang, L. and Grandhi, R.V., “Efficient Safety Index Calculation for Structural Reliability Analysis”, Computer & Structures Vol. 52, No. 1, pp. 103-111, 1994.
6. Wu Y.-T., and Wirsching, P.-H., “New Algorithm for Structural Reliability Estimation”, ASCE Journal of Engineering Mechanics, Vol. 113, No.9, pp. 1319-1336,