The performance function of a mechanical system is given by
Where  and
and  are the random variables with normal
distributions. Their mean values and standard deviation values are (10,10) and
(5,5), respectively. If the performance function,
are the random variables with normal
distributions. Their mean values and standard deviation values are (10,10) and
(5,5), respectively. If the performance function,  , then the system is always safe. Find the
probability of failure for the mechanical system.
, then the system is always safe. Find the
probability of failure for the mechanical system.
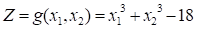
Sol: Figure 1 shows the results of Monte Carlo Simulation. Monte-Carlo simulation of AutoReliability provides two sampling methods such as the latin hypercube sampling and the random sampling. In this study, the Latin Hypercube sampling is employed. As the number of sample points is increased, the probability is more accurate.
(a) Critical surface
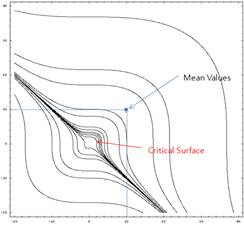
(b) Monte Carlo Simulation (N=100, Prob=0.01, COV=0.99)

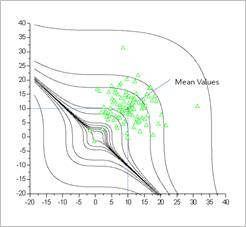
(c) Monte Carlo Simulation (N=500, Prob=0.01, COV=0.44)
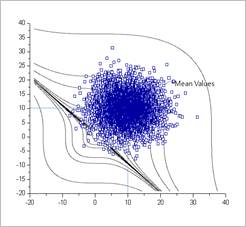
(d) Monte Carlo Simulation (N=5000, Prob=0.0068, COV=0.17)
Figure 1 Analysis results of Monte Carlo Simulations
The sample points of Figure 1 (d) showed the characteristic of Inverse CDF method clearly. Even though the random sample points are selected between 0 and 1, the inverse CDF transformation makes the real sample points distributed in their statistical distributions.
Suppose that the distributions of sample points are cut at
 and
and  . As you can see, the shapes of
distribution will be normal distributions.
. As you can see, the shapes of
distribution will be normal distributions.