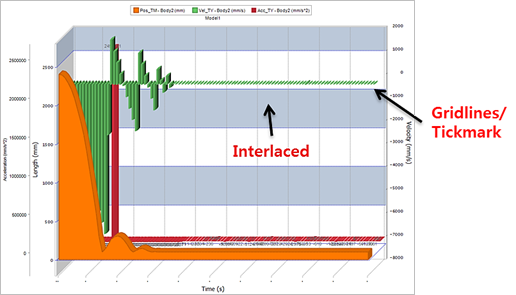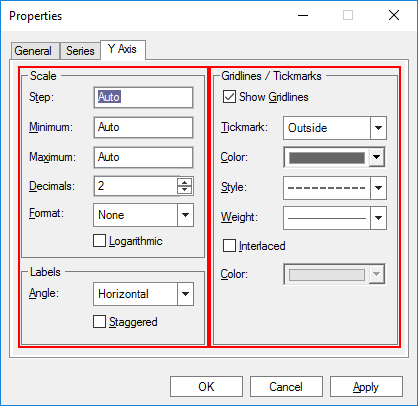
You can to change Y Axis Settings

Figure 1 Y Axis Settings of Chart

Figure 2 Y Axis of Chart Properties dialog box
•Scale Settings
•Labels Settings
•Gridlines/Tickmarks Settings
•Tickmarker
o None: Hides tick marks for the selected axis.
o Outside: Displays tick marks on the outside of selected axis.
o Inside: Displays tick marks on the inside of selected axis.
o Across: Displays tick marks that cross inside and outside of selected axis.