The user can see contour of Contact Force or Contact Pressure exerted on the wall.

Figure 1 Wall Contour icon in the Post-Process group in the External SPI tab

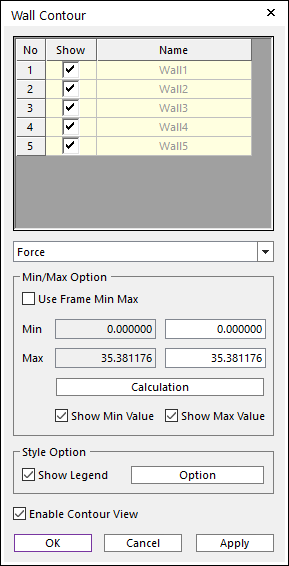
Figure 2 Wall Contour dialog box
Contour Option
•Show: By checking the Show check box for wall, user can select which contour should be displayed.
•Result Type: Selects a contour type component by choosing one of in the pull-down menu.
•Enable Contour View: Displays the contour data in the working window.
Min/Max Option
•Use Frame Min Max: If this option is checked, the min / max values of each animation frame is used.
•Calculation: Calculates the min / max values of the selected walls at the all frames for the selected Result Type.
•Min / Max: The left values are the values that are calculated for the selected Result Type. And the right values are the values applied to contour and you can modify it.
•Show Min / Max Value: Displays the position that have the min / max values for the simulation time.
Style Option
•Show Legend: If this option is checked, a legend bar will be displayed.
•Option: Opens the Legend Option dialog.

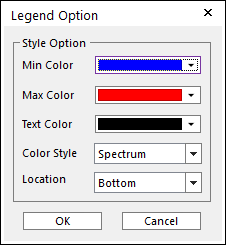
Figure 3 Legend Option dialog box
•Min Color: Selects a color for minimum value.
•Max Color: Selects a color for maximum value.
•Text Color: Selects a color for text.
•Colors Style: Selects a type to full colors in the contours. (The default is Spectrum.)
•Location: Selects the position of legend. (The default is Bottom)
Step to view Contour Animation

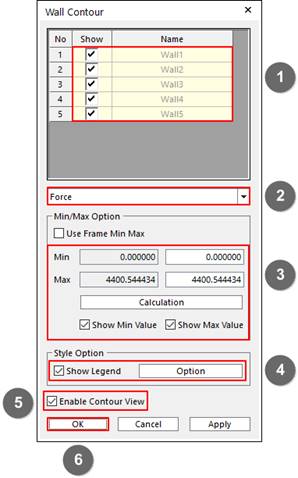
Figure 4 Wall Contour example
3. Perform the dynamic analysis of a particle model.
4. Click the Wall Contour icon in Post-Process group. The dialog box shown in Figure 4 appears.
① Check arbitrary Wall to be shown.
② Select the Result Type of wall contour.
③ Click the Calculation button to find Min/Max value for selected wall and if you would like to set the minimum and maximum values to be used, modify the Min/Max value.
④ Set the style option of Legend if you want.
⑤ Check Enable Contour View to activate the wall contour.
⑥ Click OK button