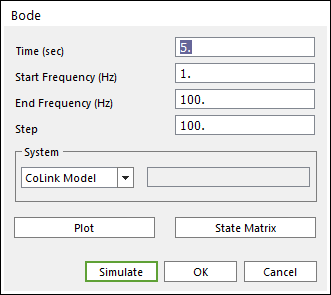
Before confirm a result of Bode diagram or state-space matrix, the user must simulate first. During simulation, dialog of the Bode tool is automatically closed. Therefore, if the user wants to see results, open dialog of the Bode tool. Subentities describes as follows.

Figure 1 Bode dialog box
•Time (sec): Time setting. Default value is 0.0 (sec). The others are not available in current version.
•Start frequency (Hz): Start frequency for Bode diagram.
•End frequency (Hz): End frequency for Bode diagram.
•Step: The number of sampling data between start and end frequency for Bode diagram. If the user wants to get smooth data, choose greater than default value.
•System: Selects CoLink Model or CoLink Block.( You can select the analysis of CoLink model or the analysis of specific block for CoLink model.)
o CoLink Model: Performs the Bode analysis of an activated model.
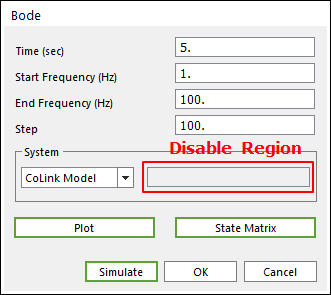
Figure 2 CoLink model type
o CoLink Block: Performs the Bode analysis of a selected block by clicking E.
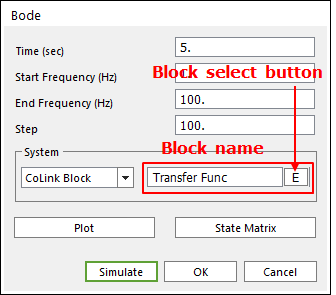
Figure 3 CoLink block type
•Plot: Reports Bode diagram.
•State matrix: Reports state-space matrix.
Bode Plot
Choose plot button on dialog of the Bode tool when the user simulates successfully.
•Magnitude
•Phase: Unit of phase result is (degree).
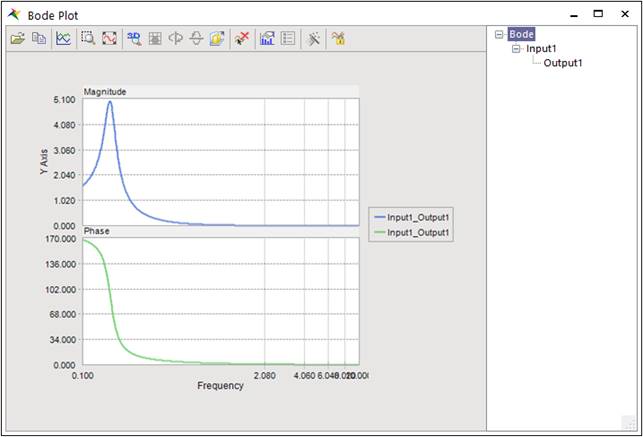
Figure 4 Bode plot (Bode diagram)
Choose State matrix on dialog of the Bode tool when the user simulates successfully.
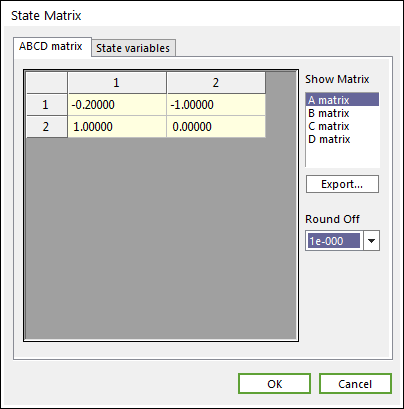
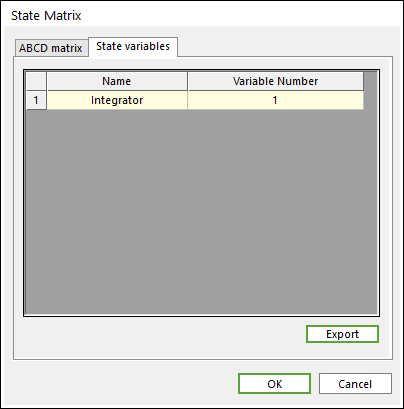
Figure 5 State matrix dialog
•A matrix
•B matrix
•C matrix
•D matrix
•Export: Exports state matrixes to the M file which is easily usable in MATLAB.
•Round off (Drop-down button): Uses this option when you export state matrix to M file. Sets the round-off of exporting data.
•State variables
•Export: Make a text file including state variables.