1. Effect analysis
Users can analyze the effect of design variable about the selected performance index.

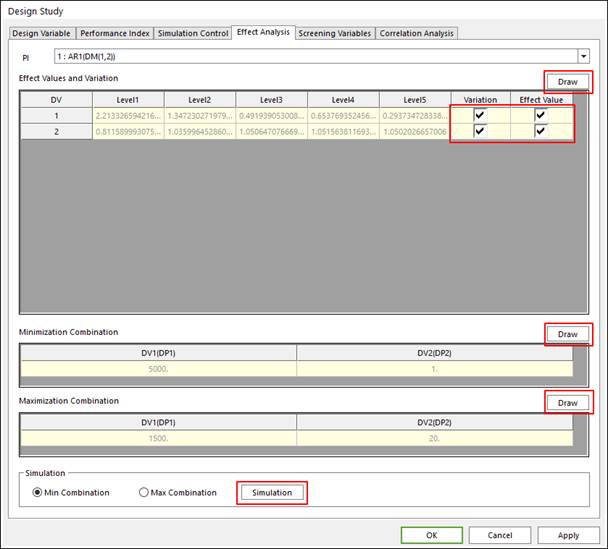
Figure 1 Effect Analysis tab of the Design Study dialog box
•PI: Selects performance index for effect analysis
•Effect Value: Selects design variable for effect analysis plot. Then click the ‘Draw’ button for plotting like as the Figure 1
•Maximization Combination & Minimization Combination: It shows the value of the design variable about the case of the maximization or minimization case of selected PI like as the Figure 2
•Simulation: Simulate for the case of the maximization or minimization combination.
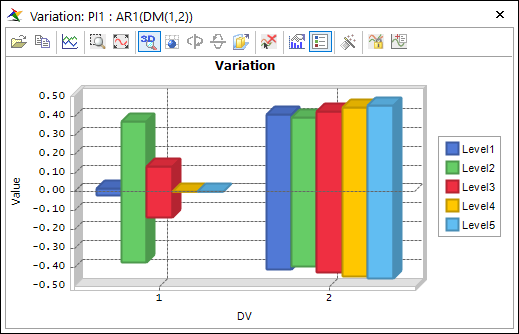
Figure 2 Effect Analysis plot
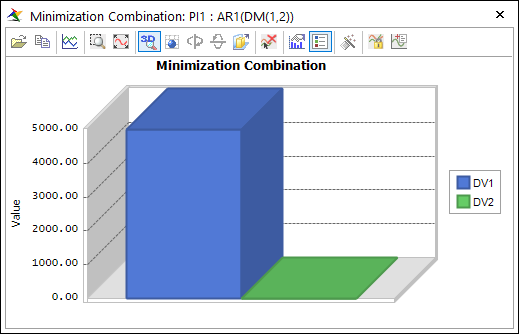
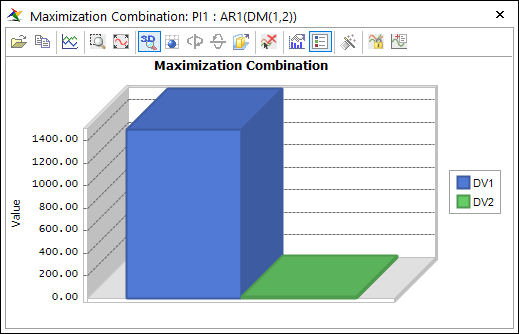
Figure 3 ‘Minimization Combination’ & ‘Maximization Combination’
2. Screening variable
Sometimes, some defined design variables cannot affect the defined performance indexes, and one wants to redefine model except the not effected design variables. For that case, this screening variable tool is supported.
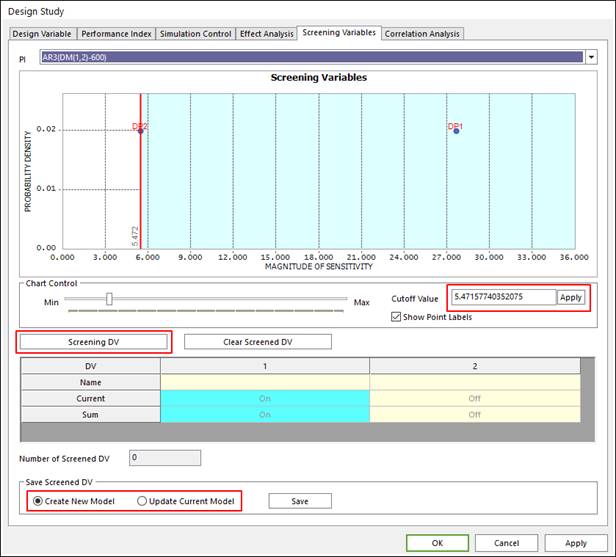
Figure 4 Screening Variables tab of the Design Study dialog box
•PI: Select performance index for screening
•Cutoff Value: Cutoff Value is represented a red line in the plot in Figure 4. ‘Apply’ button can make to refresh the cutoff value line in plot.
•‘Screening DV’ button: If one is ready to screen design variable, click this button, then the left side design variable of the cutoff value line is turn off.
•Number of Screened DV: This is represented the total number of screened design variables.
•Update DV: Make model applied screened design variable as new model or current model. Select model type and click ‘Save’ button.
3. Correlation Analysis
In ‘Correlation Analysis’ page, user can plot the relationship between performance indices. Figure 5 shows the typical result. The one performance index must be selected for each axis, and the next users click ‘Draw’ button.
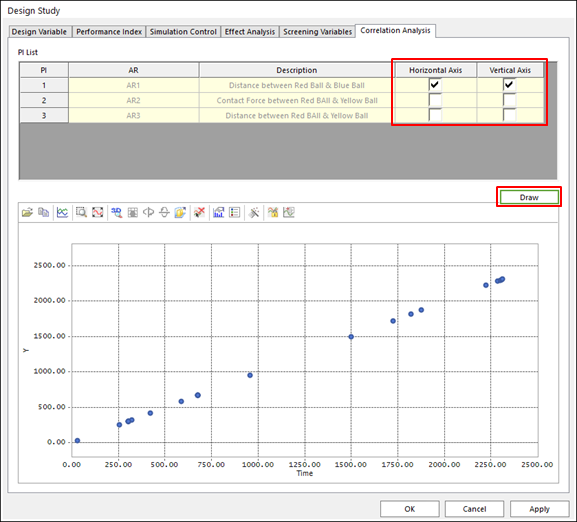
Figure 5 Correlation Analysis tab of the Design Study dialog box