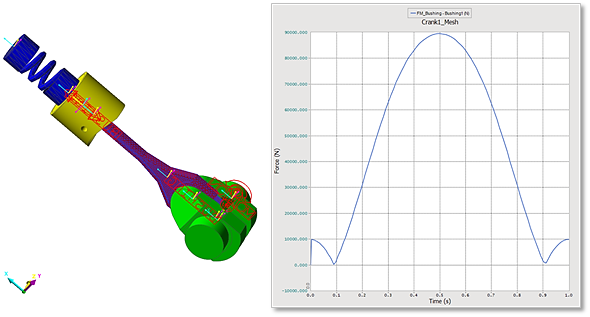
The user can use some tools for the drawn plot curve.

Figure 1 Tools group in the Home tab
The user can capture all Plot windows without the Menu Bar.

Figure 2 Capture All Plot Windows
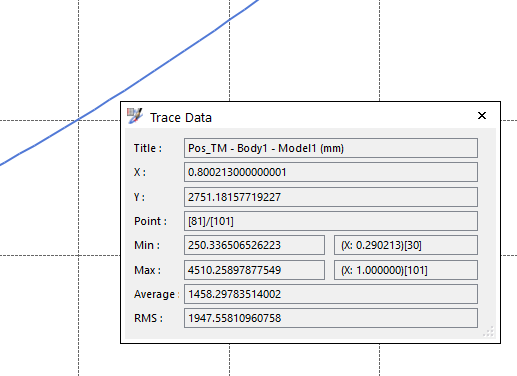
Trace mode allows the user to read the index, coordinates, Min value, Max value, Average value and RMS value of a data. When the user selects the trace mode, the user will have a target cursor. As the user brings the cursor near to the curve, the Point, Coordinates, Min value, Max value, Average value and RMS value of your data will be displayed with a reference board.

Figure 3 Trace Mode
Copy Data
The user can copy all data of curves drawn.
The user can delete it after selecting a drawn plot curve. Pressing the Del key is the same function as Delete Curve.
The user can delete all drawn plot curves in the current selected window. Pressing the C key is the same function as Clear Page.
Clear Window
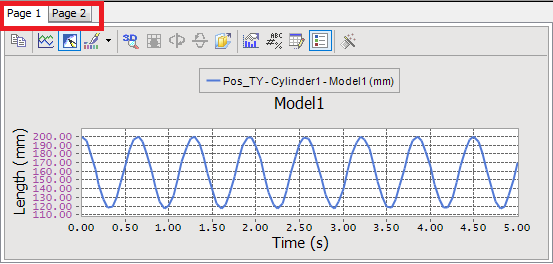
The user can delete all drawn plot curves in pages of the current selected window.

Figure 4 Clear Pages
Clear All Windows
The user can delete all drawn plot curves in all windows of the plot.