Step to see the Animation Result
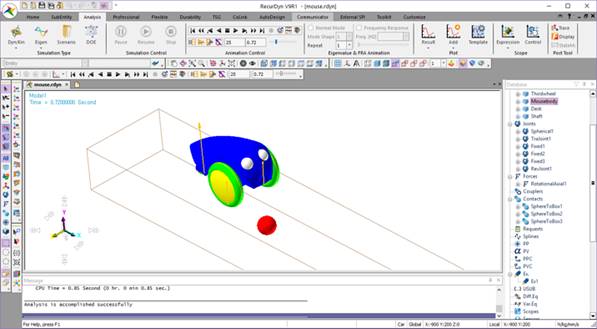
1. In RecurDyn, play the animation.
Figure 2 Show the animation
Step to see the Plot Result
2. To plot the output data, click the Result icon of Plot group in Analysis tab.
3. Expand the “Plant Input” item in the database window on the right side. Expand the Control_torque. Double-click on “Value” in the section and adjust the label and axes to get the plot below.
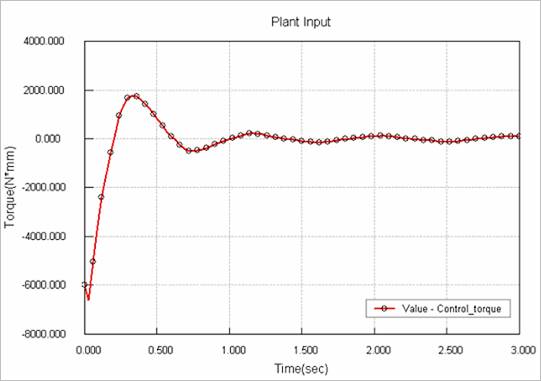
Figure 2 Plot of Value-Control_torque
4. Expand the “Plant Output” item. Expand the “displacement” and “velocity” and double-click on each Value.
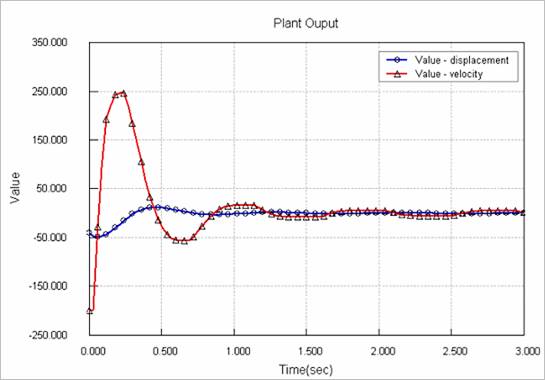
Figure 3 Plot of Value-displacement and Value-velocity