1. Click the Plot icon of the Plot group in the Analysis tab.
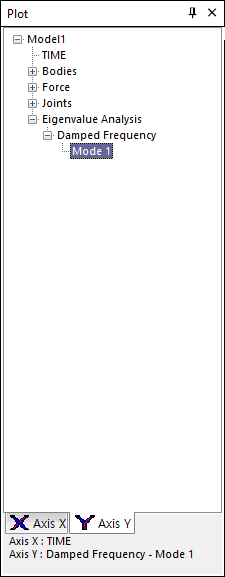
Figure 1 Plot database window
2. Double click the Mode 1 in the plot database window, and the damped frequency curve will be generated.
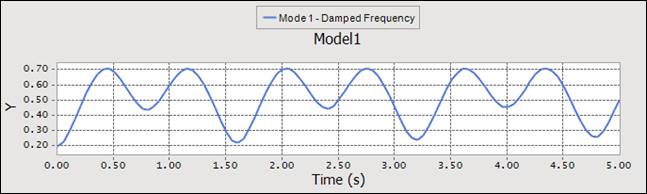
Figure 2 The damped frequency curve
Note
When the user simulates using Scenario analysis with Eigenvalue and Dynamic analysis, RecurDyn doesn’t report data of Eigenvalue in the *.RPLT file.
RecurDyn creates the *.FRQ file. The *.FRQ file contains the undamped/damped natural frequency with the time step.