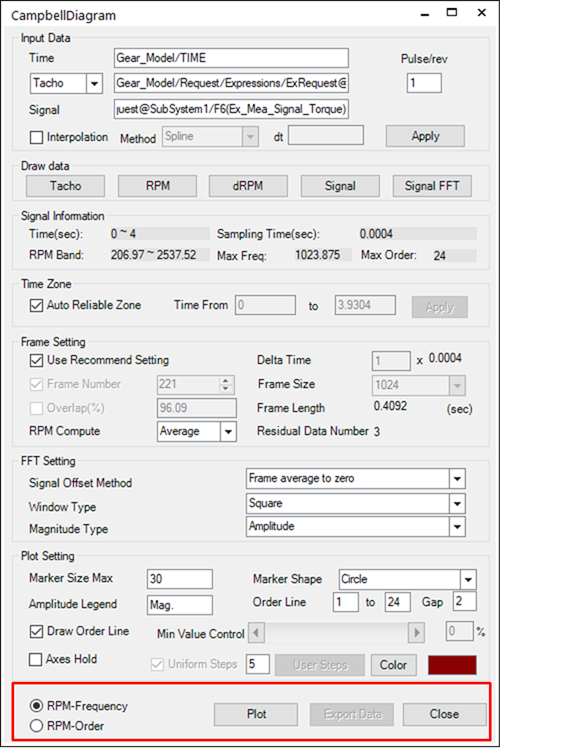
After the user configures all of the settings, click Plot to draw the Campbell diagram.
•RPM-Frequency: Shows the magnitude value to the RPMs against frequency graph
•RPM-Order: Expresses the frequency using order by converting the RPMs against frequency graph. The following is the formula for the conversion.
•N = Frequency*60/ Ω (N:Order, Ω:RPM)
Figure 2 shows the constant ratio plot that compares RPMs against order after conversion.
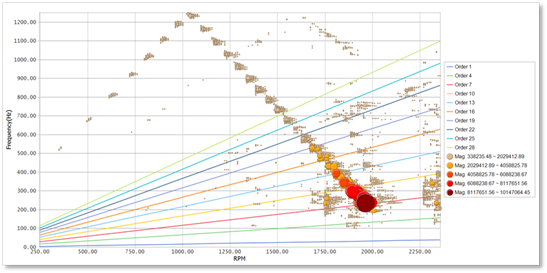
Figure 1 Constant band plot
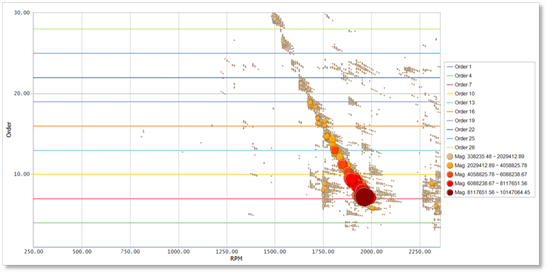
Figure 2 Constant ratio plot
•Exporting Data: The user can export the signal handling data (RPMs against frequency against magnitude) used in the Campbell diagram into a text file. The data formats for export are as follows.
|
RPM(0) |
RPM(1) |
RPM(2) |
RPM(3) |
… |
RPM (n) |
|
|
Freq(0) |
Mag(0) |
Mag(0) |
Mag(0) |
… |
… |
Mag(0) |
|
Freq(1) |
Mag(1) |
Mag(1) |
Mag(1) |
… |
… |
Mag(1) |
|
Freq(2) |
Mag(2) |
Mag(2) |
… |
… |
… |
Mag(n) |
|
Freq(3) |
Mag(3) |
… |
… |
… |
… |
… |
|
… |
… |
…. |
… |
… |
… |
… |