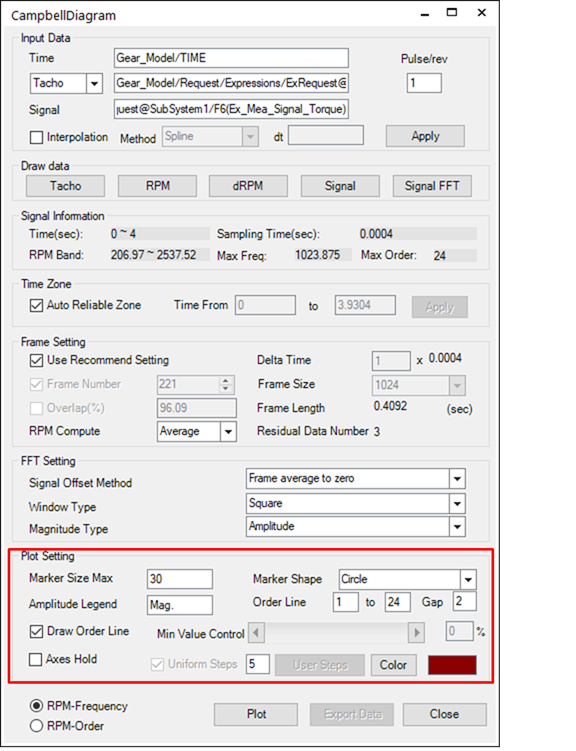
The plot settings configure the processes used to draw the signal-processed results in RecurDyn Postprocessor.
•Marker Size Max: Specifies the size of the marker used to mark the magnitude in a Waterfall plot.
•Marker Shape: Specifies the type of marker used to mark the magnitude.
•Amplitude Legend: Specifies the name of the amplitude to enter in the legend.
•Order Line: Specifies the frequency line that the RPMs show and allows a line to be drawn for the RPM value.
•Frequency(Ω) = N*Ω/60 (N:Order, Ω:RPM)
•A to B Gap C: A is the beginning value of N and B is the ending value. The gap is the interval of increasing N.
•Draw Order Line: Specifies whether to draw the order line.
•Min Value Control: Since Campbell diagrams use the size and color of a point to represent its magnitude value, it cannot draw all points. Therefore, you should determine the minimum value to be included on the plot. If the user moves the min value control towards -%, then the specific value decreases and more points are shown. If the user moves it towards +%, then the number of points decreases.
•Axes Hold: The user can specify axes setting as his own. However, the plot function basically resets all axes settings. If this option is checked, it prevents reset axes settings. Especially, when the user sets axes to zoom up the special area and doesn’t want to change range settings.
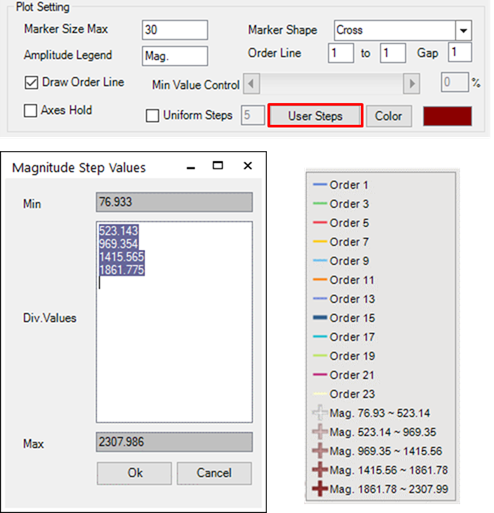
•Uniform Steps: The step drawing bubble size can be changed by this option. The Plot function divides steps as linear level of magnitude using this input number.
•User Steps: The step drawing bubble size can be defined by the user. If the user inputs step values on the text body directly in the User Steps dialog, then the Campbell plot is applied the bubble size as input levels when Plot is clicked.