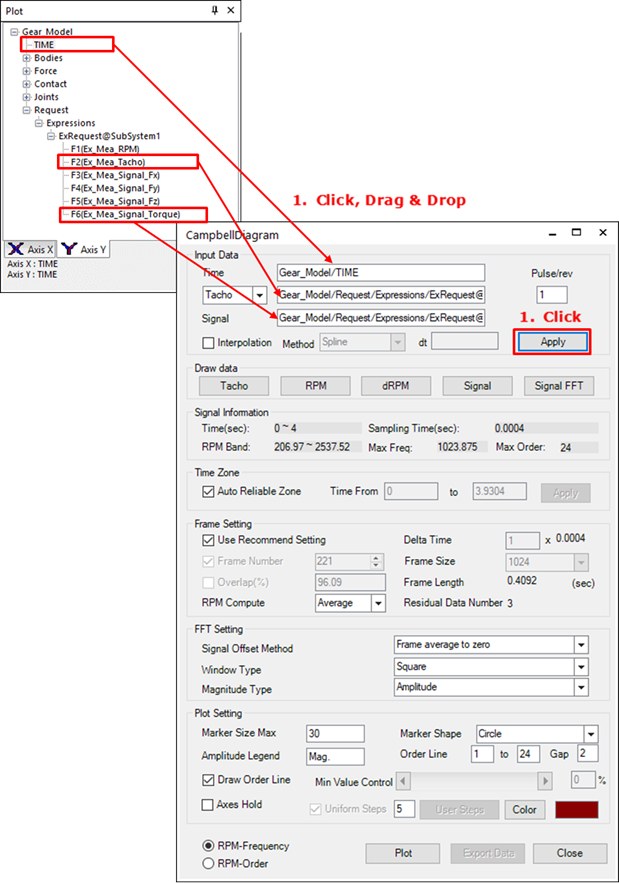
The data necessary to produce the Campbell diagram should appear in the Plot database window. If the RPM and signal data extracted from the test are in text files, then the user can drag and drop the text files into the Plot database window to register the data. This sample uses data from the analyzed Gear_Model. If you skipped the modeling tutorial and began this chapter from Plotting the Campbell Diagram section, then the user can drag and drop the Gear_Model.rplt file from the sample folder to the Plot database window to use as analysis results. The user can drag data from the Plot database window and drop it into the Campbell dialog box to enter it. If the user clicks Apply when the user has entered all of the data, all of the menus become activated and the Default Settings are selected.
•Pulse/rev or RPM Multiplier: After the user enters the tacho signal or RPM data, the final RPM is multiplied by the Pulse/rev or RPM Multiplier. The default value is '1.' This function is used when the RPM of the entered signal is a multiple of the actual system RPM or when one cycle of the tacho signal is a multiple of the actual cycle.
•Interpolation: When the report step size is not uniform, the Interpolation is necessary. There are two interpolation types, Linear type and Spline type. The user check on the interpolation option, select the interpolation type and insert desired step size and the interpolated signal data will be used for Campbell diagram.
Note
If the Input type is changed from Tacho to RPM, the title displayed on the dialog, which is “Pulse/rev”, will be converted to “RPM Multiplier”, as shown in the figure.
