You can to change Chart Series Settings. The chart series are represented by groups of data points.
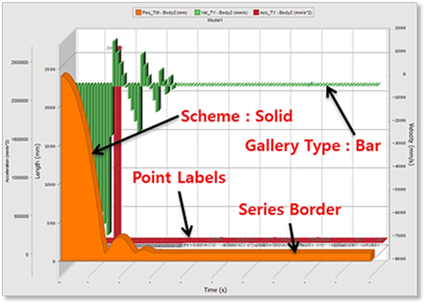
Figure 1 Series Settings of Chart
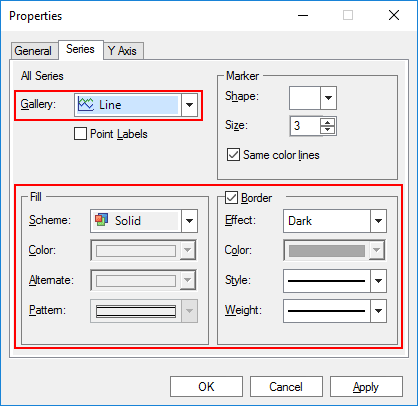
Figure 2 Series tab of the Chart Properties dialog box
Gallery Type Settings
•Line: The line chart show trends in data at equal intervals and are effective for comparing highs and lows in a continuum. In a 2D line chart additional lines will be drawn in the main chart area and, in the case of 3D line charts, lines could be displayed at the same level or clustered in the Z axis.
•Curve: The curve charts will use a spline algorithm to draw a curve between the points in the chart, rather than connecting the points directly with a straight line.
•Scatter: The scatter plots (also called scatter diagrams or XY charts) are used to investigate the possible relationship between two variables that both relate to the same "event." Each point in a XY Plot is defined by two coordinates (X, Y). This results in several important aspects regarding XY charts.
•Area: The area charts are essential with the discontinuous breaks removed along the horizontal axis. Data is not broken into discrete bars but appears in a continuous ebb and flow as defined against the Y axis. Consequently, the area charts are particularly useful for emphasizing the magnitude of change over time. In addition, the area charts can be used for the same purposes as bar charts.
•Area – Curve: The area charts are essential with the discontinuous breaks removed along the horizontal axis. Data is not broken into discrete bars but appears in a continuous ebb and flow as defined against the Y axis. Consequently, the area charts are particularly useful for emphasizing the magnitude of change over time. In addition, area charts can be used for the same purposes as bar charts.
•Step: Rather than connecting the points with a straight line, these charts display one set of data as steps in a line. These charts are used to illustrate trends between more than two members of nominal or ordinal scales.
Fill Settings
•Scheme
•Solid: Solid Color.
•Monochrome: Black & White patterns.
•Pattern: Colored patterns.
•Gradient: when painting the chart series
Border Settings
Apply various borders of the series/points.
•Effect
•None: No border effect is applied. The border effect must be None for the Border Color property to take effect.
•Raised: The border has raised inner and outer edges.
•Light: Applies a light color to the border using the series/points color.
•Dark: Applies a dark color to the border using the series/points color.
•Opposite: Selects between a dark and a light border depending on the object color.
•Shadow: The border will have shadow.