Scope Control helps users to manage multiple scopes.
Figure 1 Scope Control icon of the Scope group in the Analysis tab
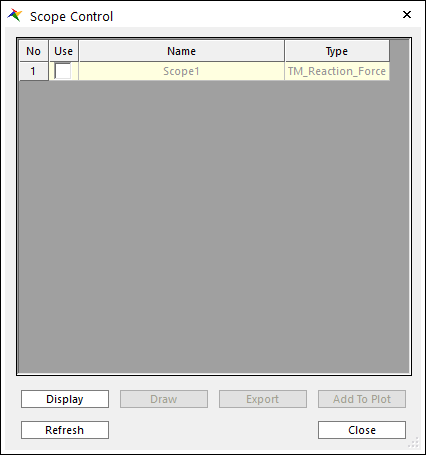
Figure 2 Scope Control dialog box
•Display: Show selected scopes in each window.
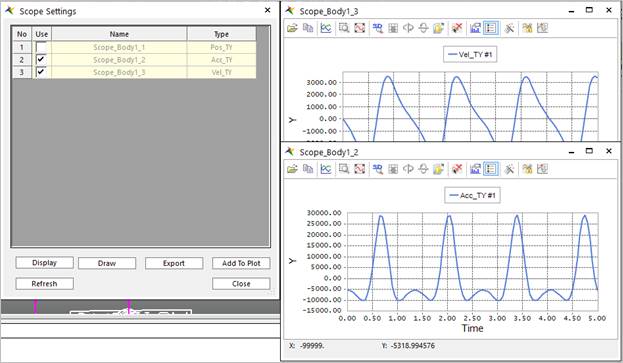
Figure 3 Display selected scopes
•Draw: Show selected scopes in a window.
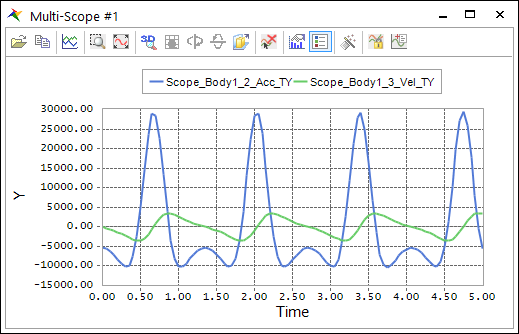
Figure 4 Draw multiple scopes in
a window
•Export: Export selected scopes’ curve data to a txt or a csv format.
•Add To Plot: Add scope curves to a plot.
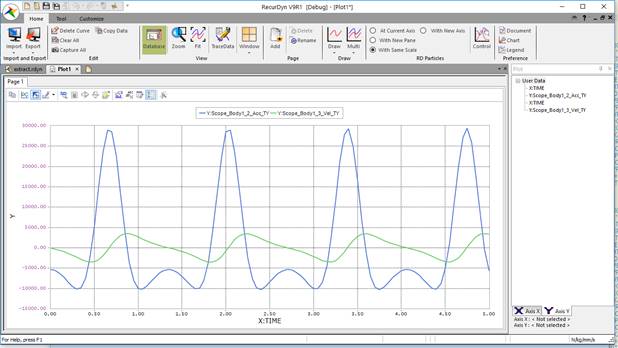
Figure 5 Multiple scopes are added to a plot
•Refresh: Refresh the scope list on the scope settings. If any scope is added to the model while the Scope Settings is opened, use Refresh to apply changes to the scope list.