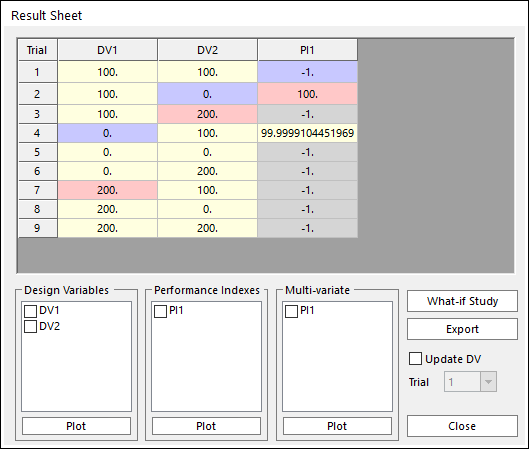
After running a design study, the user can examine the results in tabular or graphical formats within the Result Sheet dialog box. The performance index values can be viewed in the performance index output file (*.rpi).
Figure 1 Result Sheet tabular
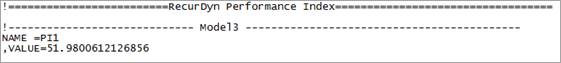
Figure 2 Performance Index Output file(*.rpi)
•If the column is purple, it means the minimum value.
•If the column is red, it means the minimum value.
•If the column is gray, it means the simulation fails. If the Return Value when simulation fails is the minimum value, the column is purple.