You can check the result of the Iteration simulation of the TSG.
Figure 1 Result icon of the Result group in the TSG tab
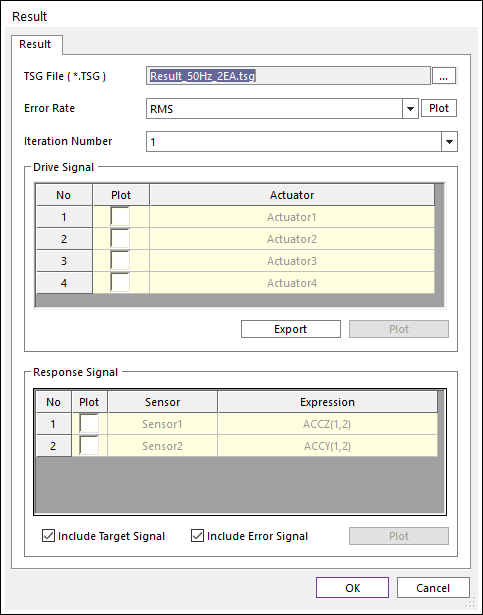
Figure 2 Result dialog box
•TSG File (*.TSG): Selects “*.TSG” result file by clicking ….
•Error Rate
•Plot: User can check the following four Error Rate on each Iteration Number.
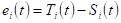
The error for any sensor i at time t can be defined as:
 (6)
(6)
Where,  : The signal of sensor i at time t.
  : The target signal for sensor
i at time
t.
: The target signal for sensor
i at time
t.
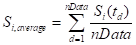
The average signal  and average target signal
 for any sensor i can be defined as
:
for any sensor i can be defined as
:
 (7)
(7)
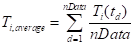 (8)
(8)
Where,  : The number of data for each
sensor (=End time x Sampling frequency + 1).
: The number of data for each
sensor (=End time x Sampling frequency + 1).
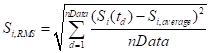
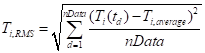
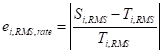
The root mean square signal  , target signal
  , and error rate
  for any sensor i can be defined as:
 (9)
(9)
 (10)
(10)
 (11)
(11)
From this, the following error terms can be derived:
|
Error Term |
Equation |
|
RMS |
|
|
Max |
max( |
|
Min |
min( |
|
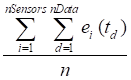
Average |
|
|
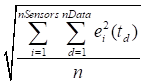
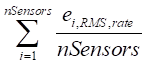
RMS Error Rate |
|
Table 1 Error Rate
Where,  : The total number of data for all
sensors (= Number of sensors x (End time x Sampling Frequency + 1) ).
: The total number of data for all
sensors (= Number of sensors x (End time x Sampling Frequency + 1) ).
•Iteration Number: User can select the Iteration Number.
•Drive Signal
•Plot check box in list view
•Export: User can make a “*.TAI” or “*.CSV” file including the drive signals.
•Plot: User can see the signal data on the opened scope dialog.
•Response Signal
•Plot check box in list view
•Include Target Signal: If this check box is checked, then the Target signals is added in the plot.
•Include Error Signal: If this check box is checked, then the error signals (=Target(t) – Sensor(t)) is added in the plot.
•Plot: User can see the signal data on the opened scope dialog.