Figure 1 FFT icon of the Analysis group in the Tool tab
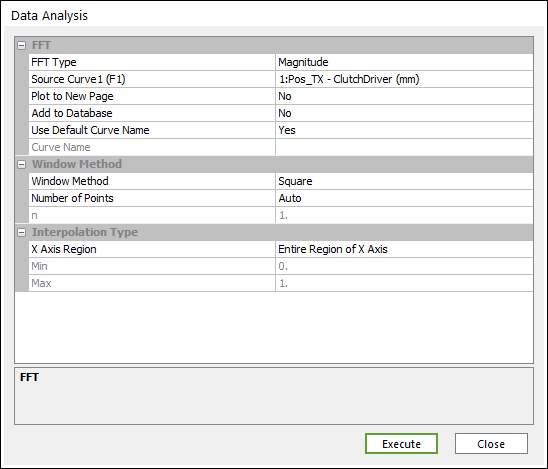
Figure 2 Data Analysis dialog box [FFT]
FFT
•FFT Type: Selects a type of FFT.
•Magnitude
•Phase
•Power Spectral Density
•Source Curve: Selects a curve.
•Plot to New Page: If the user wants to draw to a new page, select Yes. If the user wants to draw to the current page, select No. (The default option is No.)
•Add to Database: If the user wants to add a desired result to the database, select Yes. (The default option is No.)
•Use Default Curve Name : If you want to use the default curve name like “ADD(Acc_TM-Body1(mm/s^2), Vel_TM-Body1(mm/s))”, select Yes. If not, the Chart use the Curve Name.
•Curve Name : If “Use Default Curve Name” is No, Chart use this for a name.
Window Method
•Window Method Type: Selects a type of the window method.
•Square
•Barlett
•Welch
•Hanning
•Hamming
•Blackman
•Number of Points Type: Selects a type of the number of points.
•Auto
•2^n
•n: Number n used in 2^n.
Interpolation Type
•X Axis Region
•Entire Region of X Axis
•Specified Region of X Axis: Set up Min and Max.
•Min: Minimum X value.
•Max: Maximum Y value.