Figure 1 Interpol. icon of the Analysis group in the Tool tab
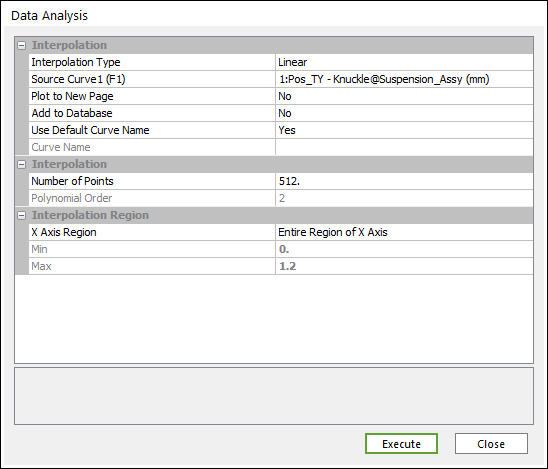
Figure 2 Data Analysis dialog box [Interpolation]
Interpolation
•Interpolation Type: Selects a type of Interpolation.
•Linear
•Polynomial
•Akima Spline
•Cubic Spline
•Source Curve: Selects a curve.
•Plot to New Page: If the user wants to draw to new page, select Yes. If the user wants to draw to current page, select No. (The default option is No.)
•Add to Database: If the user wants to add a desired result to the database, select Yes. (The default option is No.)
•Use Default Curve Name: If you want to use the default curve name like “ADD(Acc_TM-Body1(mm/s^2), Vel_TM-Body1(mm/s))”, select Yes. If not, the Chart use the Curve Name.
•Curve Name: If “Use Default Curve Name” is No, Chart use this for a name.
•Number of Points: The default is 512. The user must enter a positive integer. If the user is preparing the curve for an FFT operation, RecurDyn/Plot recommends that the number of points be an even power of two (for example, 256, 512, 1024, and so on).
•Polynomial Order: Sets the order of polynomial function. If the user selects Polynomial of Operation Type, this is activated.
Interpolation Region
•X Axis Region
•Entire Region of X Axis
•Specified Region of X Axis: Set up Min and Max.
•Min: Minimum X value.
•Max: Maximum Y value.