Figure 1 Math icon of the Analysis group in the Tool tab
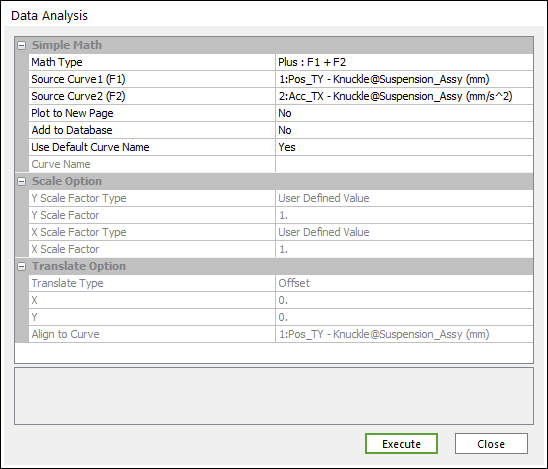
Figure 2 Data Analysis dialog box [Math]
Simple Math
•Operation Type: Selects a type of the Math operation.
•Plus
•Minus
•Multiply
•Divide
•Absolute
•Scale
•Translate
•Source Curve 1 (F1): Selects the 1st curve.
•Source Curve 2 (F2): Selects the 2nd curve.
•Plot to New Page: If the user wants to draw to new page, select Yes. If the user wants to draw to current page, select No. (The default option is No.)
•Add to Database: If the user wants to add a desired result to the database, select Yes. (The default option is No.)
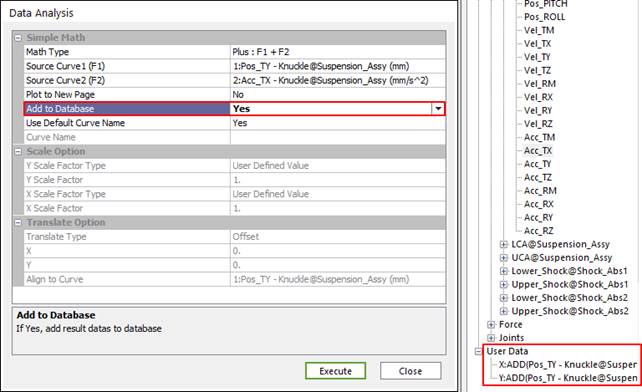
Figure 3 After performing Add to Database option
•Use Default Curve Name: If you want to use the default curve name like “ADD(Acc_TM-Body1(mm/s^2), Vel_TM-Body1(mm/s))”, select Yes. If not, the Chart use the Curve Name.
•Curve Name: If “Use Default Curve Name” is No, Chart use this for a name.
Scale Option
If the user selects Scale of Operation Type, this is activated.
•Scale Factor Type: Select a type of Scale Factor.
•User Defined Value
•Degree -> Radian
•Radian -> Degree
•rad/s -> RPM
•RPM -> rad/s
•Scale Factor (alpha): Sets a value of scale Factor.
Translate Option
If the user selects Translate of Operation Type, this is activated.
•Translate Type: Selects a type of Translate.
•Offset: Offsets a curve as X and Y values.
•Move 1st Point to: Offsets the 1st point of a curve as X and Y values.
•Align to Curve: Offsets the 1st Point of a curve as 1st Point of a curve selected in Align to Curve.
•X: X value
•Y: Y value
•Align to Curve: Selects a curve to align.