Figure 1 Filter icon of the Analysis group in the Tool tab
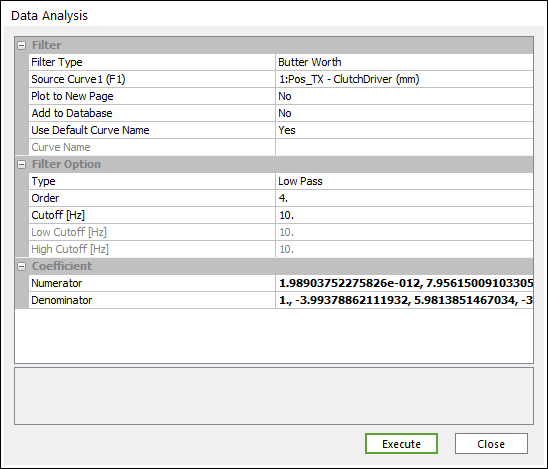
Figure 2 Data Analysis dialog box [Filter]
Filter
•Filter Type: Selects a type of filter.
•Butter Worth
•Translator Function
•Curve: Selects a curve.
•Plot to New Page: If the user wants to draw to a new page, select Yes. If the user wants to draw to the current page, select No. (The default option is No.)
•Add to Database: If the user wants to add a desired result to the database, select Yes. (The default option is No.)
•Use Default Curve Name : If you want to use the default curve name like “ADD(Acc_TM-Body1(mm/s^2), Vel_TM-Body1(mm/s))”, select Yes. If not, the Chart use the Curve Name.
•Curve Name : If “Use Default Curve Name” is No, Chart use this for a name.
Filter Option
If the user selects Butter Worth Filter, This is activated.
•Type: Selects a type.
•Low Pass
•High Pass
•Band Pass
•Band Stop
•Order
•Cutoff(Hz)
•Low Cutoff(Hz)
•High Cutoff(Hz)
Coefficient
If the user selects Butter Worth Filter, these values are updated automatically.
If the user selects Translator Function, inputs these values directly.
•Numerator
•Denominator