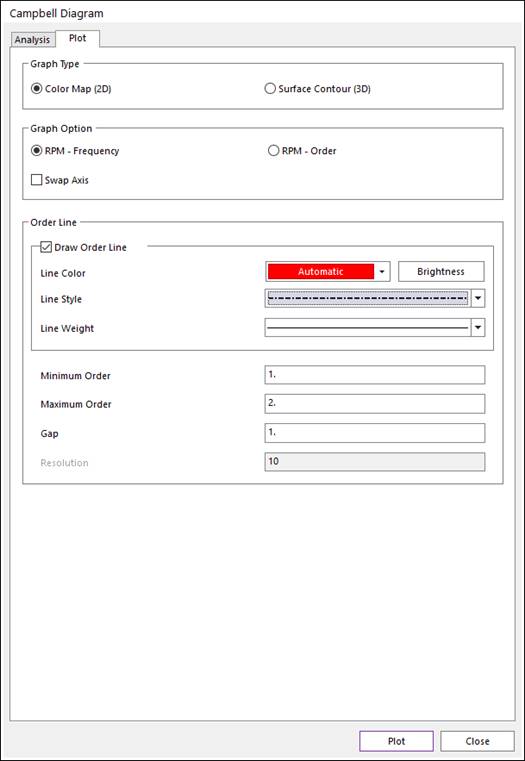
Figure 1 Plot tab
Graph Type
•Color Map: It displays 2D graph of Campbell Diagram.
•Surface Contour: It displays 3D graph of Campbell Diagram.
Graph Option
•RPM-Frequency: Shows the magnitude value to the RPMs against frequency graph
•RPM-Order: Expresses the frequency using order by converting the RPMs against frequency graph. The following is the formula for the conversion.
•N = Frequency*60/ Ω (N: Order, Ω: RPM)
•Swap Axis: Swaps the X-Y Axis of the plot.
Order Line
•Draw Order Line: Specifies whether to draw the order line.
•Frequency(Ω) = N*Ω/60 (N: Order, Ω: RPM)
•Note: In case of RPM-Order Graph, the Order Line settings affects the Order-Axis. Minimum and Maximum Order becomes the range of Order-Axis. The resolution sets the number of data between each Order Lines.
•Line Color: It specifies the order line color.
•Brightness: It specifies the brightness of order line. It supports numbers between 0 ~ 255 (brightest).
•Line Style: It specifies the line style of order line.
•Line Weight: It specifies the line weight of order line
•Minimum Order: It is the beginning value of order line.
•Maximum Order: It is the ending value of order line.
•Gap: It is the interval value of order line.
•Resolution: It is the number of data between each order lines.
•Plot: Draws the Campbell diagram.