The user can draw together the multiple plot data. If the user selects the parent category, the user can select all subcategories. So, in case of a RFlex model, it is useful to draw modal coordinates.
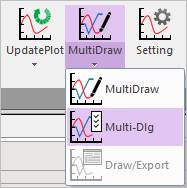
Figure 1 Multi Draw with Dialog icon of the Draw group in the Home tab
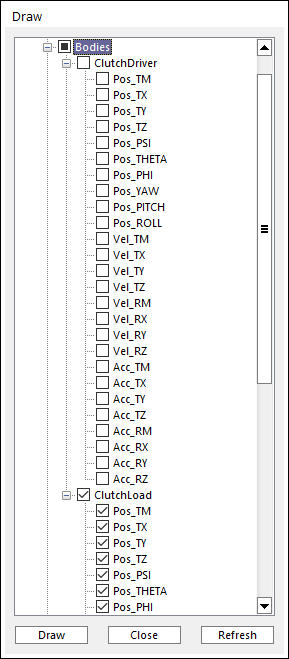
Figure 2 Draw dialog box
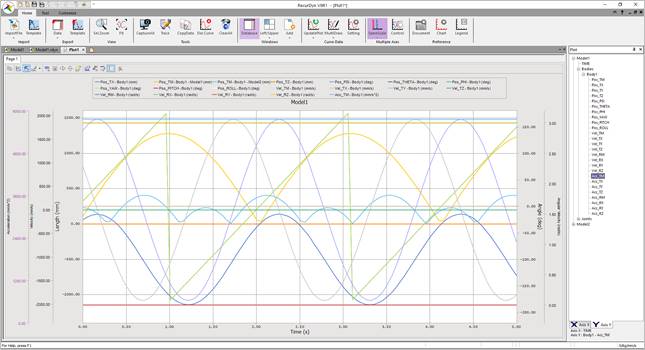
Figure 3 After performing the Multi Draw with Dialog function