The XML file installed basically provides more than a dozen of life criteria for fatigue criteria, which come with a fatigue material library contained 180 common materials. The source of the fatigue material specifications is the technical report J1099, published by the Society of Automotive Engineers (SAE). Specifications from both the original SAE report (1975) and the revised report (2002) are provided.
To obtain a copy of the technical report, refer to the SAE website: http://www.sae.org, or please click here.
The user can select a material type from the selected material library. The material library can be created by user and modified. In the Material Manager dialog box, the user can handle any kind of operations related with material library modification.
Figure 1 Fatigue Evaluation dialog box
An XML based material data system is used to create, edit, evaluate, select, and manage material properties for fatigue predictions. The user can use a text editor to open and/or create an XML file that contains the materials and their fatigue properties, or they can use the Material Manager dialog box to create, edit, and manage their own fatigue material libraries.
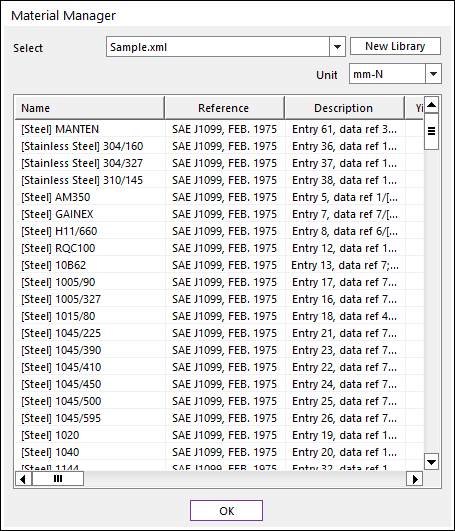
Figure 2 Material Manager dialog box
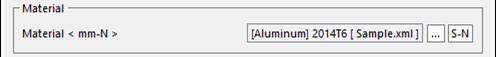
The user can enter the Material Manager dialog box by clicking on the “…” icon on the Fatigue Evaluation dialog. On the “Material Manager” dialog, first select or create a material library, which is an XML file of fatigue material properties. RecurDyn/Durability comes with a Sample.xml, which contains more than 180 sets of fatigue properties.
Once an XML library is selected or created, all available materials in that library are displayed in the form. For each material, it lists a set of properties including material name, modulus of elasticity, Poisson’s ratio, yield stress, ultimate stress, and a variety of cyclic stress-strain conversion coefficients and properties.

Figure 3 The way to select a material
If the user clicks the right mouse button on the material, user can see following right-click menu. Also, with this right-click menu, the user can select (i.e. “Make Active”), edit (i.e. “Edit”), create (i.e. “New Material…”), copy (i.e. “Copy”), paste (“Paste”), and delete (i.e. “Delete”) materials.
If the user selects “Edit…”, the user can modify the material information in the below property dialog box.
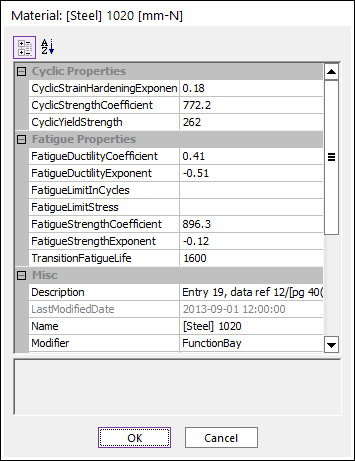
Figure 4 Material properties
In addition, if the user clicks S-N, the user can check the S-N Curve for the selected current material type. The S-N curve describes the fatigue behavior of the material, which is normally defined by a set of fatigue material properties that are obtained from test data by using curve-fitting approaches. This curve is normally defined on log-log scales whose y-axis is either the alternating stress (or the alternating strain) or the stress range (or the strain range). And x-axis is either the number of cycles (Nf) to failure or the number of reversals to failure (2*Nf).
If the fatigue influencing factors are set as a value in Preferences such as Notch Factor Amp, Surface Factor, and so on, these factors will affect to draw the S-N Curve. Therefore, in this case, the S-N Curve shows two types of curves as shown in the Figure 5. The blue one is the S-N curve which is not affected by fatigue influencing factors, and the red one is the S-N curve which is affected by them.
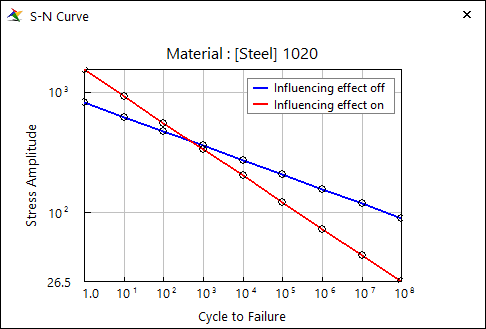
Figure 5 S-N Curve
When drawing the S-N curve after selecting the Manson-Coffin stress life criteria, it is necessary to input the following information such as the fatigue strength coefficient and the fatigue strength exponent because Manson-Coffin life equation should be used. This equation is as follows.
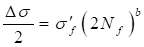
where
 ∶ Normal stress amplitude for a
cycle
∶ Normal stress amplitude for a
cycle
 ∶ Fatigue strength
coefficient
∶ Fatigue strength
coefficient
 ∶ Reversals to failure
 ∶ Fatigue strength exponent
(material property)
∶ Fatigue strength exponent
(material property)
In other hand, when drawing the S-N curve after selecting the Manson-Coffin strain life criteria, it is necessary to input addition information such as Fatigue Ductility Coefficient, Fatigue Ductility Exponent and Modulus of Elasticity besides the necessary information when selecting the stress life criteria.
The Manson-Coffin equation for strain life is as follows.

Where,
 ∶ Normal strain amplitude for a
cycle
∶ Normal strain amplitude for a
cycle
∶ Fatigue strength
coefficient
∶ Reversals to failure
∶ Fatigue strength exponent
(material property)
 ∶ Fatigue ductility exponent
(material property)
∶ Fatigue ductility exponent
(material property)
 ∶ Fatigue ductility
coefficient
∶ Fatigue ductility
coefficient
User-Defined S-N Curve
When performing a fatigue evaluation in RD/Durability, you can select a fatigue life criterion which uses fatigue properties of the material. Another option is to create an S-N curve and use it to evaluate fatigue results.
If User-Defined is selected in all criterion section such as Stress-Based, Strain-Based and Safety Factor, the information of the Material section will be changed a pre-defined material to the S-N Curve as shown in the Figure 6.
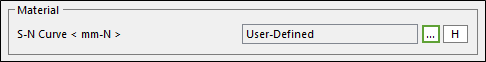
Figure 6 The User-Defined S-N Curve in Material
At that time, if you click “…”, the dialog box related to define the S-N curve will appear as shown figure 7.
In a User-Defined S-N Curve in the stress/strain life criteria, the abscissa of the stress S-N curve is the number of cycles to failure, and the ordinate of the function is the stress/strain amplitude. Therefore, in a table for S-N Curve, the first column should be contained the number of cycles to failure, and the second column should be contained the stress/strain amplitude. For reference, it is possible to apply the means stress effect (Goodman, Gerber, Soderberg, Morrow) when defining the User-Defined S-N curve by using the Material for Stress Based Life Criterion such as Yield Stress, Ultimate Strength and Fatigue Strength Coefficient. And two interpolation type can be supported as Linear and Exponential for more accurate fatigue results when using data of S-N curve. Beside of that, if the several functions such as Import, Export, Draw and so on are used, it will be easy to make and modify the user-defined S-N Curve.
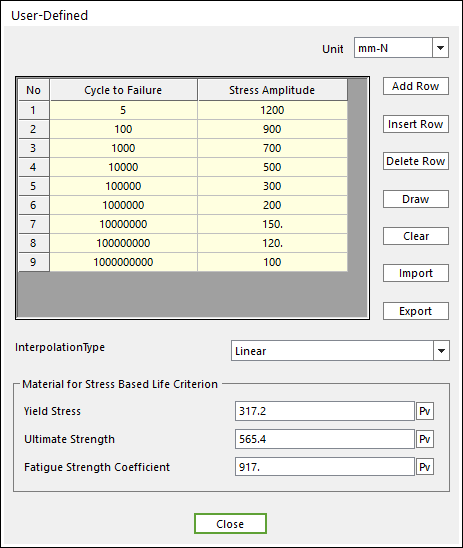
Figure 7 The table for User-Defined S-N Curve
In addition, both S-N in the figure 6 and Draw in the figure 7 perform the same role to make the S-N curve as shown figure 8.
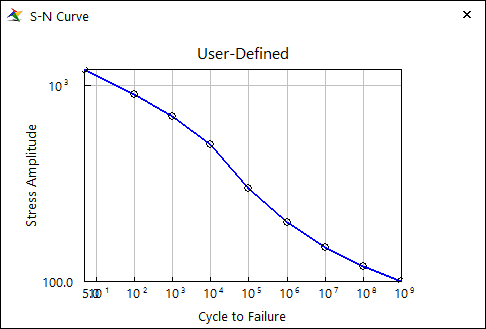
Figure 8 The User-Defined S-N Curve
In the case of the User-Defined S-N curve, two curve plots are not drawn although the user modifies the fatigue influencing factors.
When a User-defined Haigh diagram is selected in the Safety Factor criteria, the first column should be contained the stress amplitude and the second column should be contained the means stress because the abscissa of this diagram is the stress amplitude and ordinate of that is the mean stress as shown the figure below.

Figure 9 The table for User-Defined Haigh Diagram
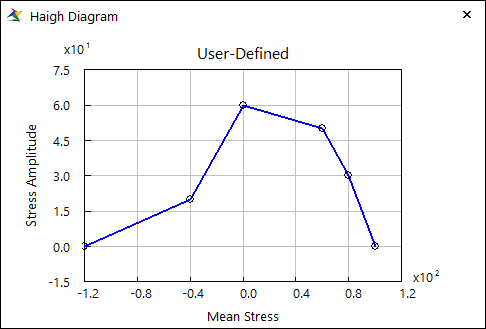
Figure 10 the User-Defined Haigh Diagram