
The INVPSD function returns the results of a time signal from a power spectral density with increasing frequency.
Format

Arguments definition
|
|
Independent variable for the INVPSD function •This variable must be time, a real number, or a function that returns a real number. |
|
Spline |
The name or argument number for the spline data defined by the subentity. |
|
|
Real value, Minimum frequency for PSD |
|
|
Real value, Maximum frequency for PSD |
|
nFreq |
Integer number that specifies the number of frequencies. This number must be larger than 1 and less than 10000. |
|
Logarithmic |
Integer number, Logarithmic steps for frequency sampling step of spline data. 0: Linear steps 1: Logarithmic steps for frequency sampling step |
|
Option |
Integer number, phase option. 0: Random Phase 1: Constant Phase |
|
Phase |
Real number (=“Phase Option” is 0 or 1 cases). A seed value whichs generated from the random number for Phase shifts. |
Formulation
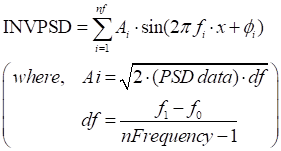
This result is summation for a series of sinusoidal functions with the amplitudes which is configured using PSD data from spline curve defined.
The phase value is calculated by a random number generator.
For random phase, there can be difference between rplt data and scope date.
In case of using the same seed value, the each result always will be keep the same value.
Example
INVPSD (time, sp1, 0.1, 30.0, 199, 0, 0, 0.0)
•x = time: Independent variable.
•Spline = sp1: the spline name.
•f0 = 0.1: Initial frequency of the sinusoidal function.
•f1 = 30.0: Final frequency of the sinusoidal function.
•nFreq = 199: the number that specifies the number of frequencies.
•Logarithmic = 0: Linear Logarithmic steps for frequency sampling step of spline data.
•Option = 0: phase option for random phase shift.
•Phase = 0.0: A seed value whichs generated from the random number for Phase shifts.
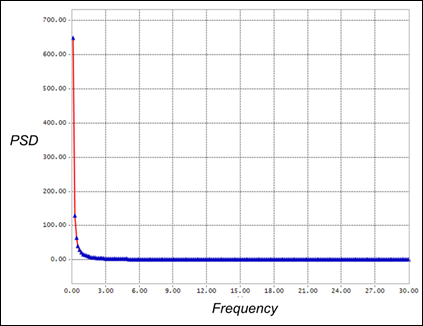
Figure 1 PSD spline data
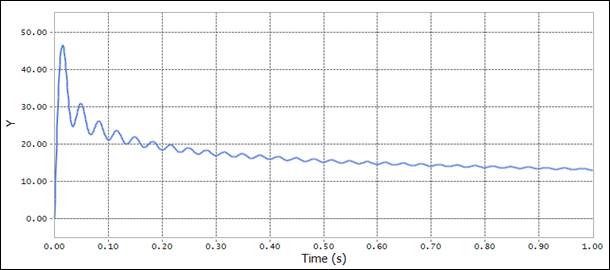
Figure 2 RPLT result using the INVPSD function (Constant Phase)
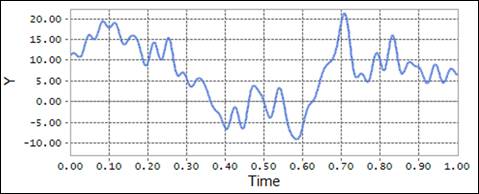
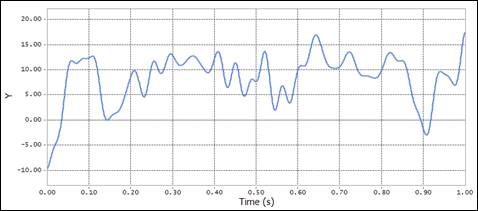
Figure 3 Scope and RPLT result using the INVPSD function (Random Phase)