 and ‘Reliability Index’
  . Then, only 2 iterations are
required to solve the reliability analysis problem. It is noted that two errors
of the final iteration meet zero.
. Then, only 2 iterations are
required to solve the reliability analysis problem. It is noted that two errors
of the final iteration meet zero.
We provide two result sheets such as ‘Result Sheet’
and ‘Summary Sheet’. Figure 1 shows ‘Result Sheet’. The
1st iteration results shows and ‘Reliability Index’ . Then, only 2 iterations are
required to solve the reliability analysis problem. It is noted that two errors
of the final iteration meet zero.

Figure 1 Result Sheet of SAO method
Next, we will explain ‘Summary Sheet’. First, it lists ‘Statistical Information’. As explained in the interpretation of Monte-Carlo simulation, Table 1 summarized the statistical parameters (Param_1 ~ Param_3). Next, let see ‘Performance index (Result)’. ‘AFORM+DRM1’ gives ‘Reliability Index = 1.1467’ and ‘Failure Probability = 0.8742’.
From the view point of robust design and 6-sigma design, one
can regard the reliability index ( ) as ‘k-sigma’ conceptually. Also, it
can be the distance from Mean value to MPP (Most Probable Point). MPP is the
nearest point on hyper-surface (PI=0) from mean value in the normalized space.
Thus, finding the reliability index is ‘constrained optimization problem’.
) as ‘k-sigma’ conceptually. Also, it
can be the distance from Mean value to MPP (Most Probable Point). MPP is the
nearest point on hyper-surface (PI=0) from mean value in the normalized space.
Thus, finding the reliability index is ‘constrained optimization problem’.
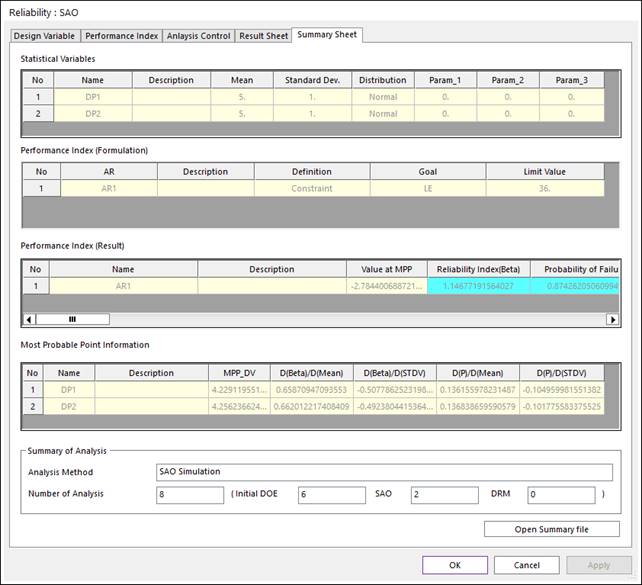
Figure 2 Summary Sheet of SAO method
In ‘Most Probable Point Information’, MPP_DV is re-transformed into the original DV space. Thus, the value of two-norm between Mean and MPP_DV becomes ‘Reliability Index’. Next, let’s consider the design sensitivity information such as D(Beta)/D(Mean), D(Beta)/D(STDV), D(P)/D(Mean), and D(P)/D(STDV). These values are the derivatives of Reliability Index and Failure Probability with respect to Mean and Standard deviation.
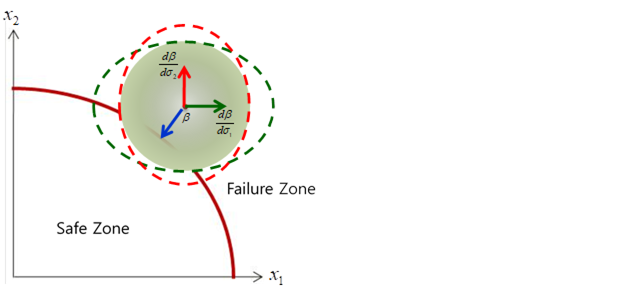
Let’s consider two cases in Figure 3 Suppose that mean value
( ) moves into (
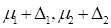 ) along the axis. Then, how much is
‘reliability index’ changed? The design sensitivity D(Beta)/D(Mean) is
the change rate of ‘reliability index’.
) along the axis. Then, how much is
‘reliability index’ changed? The design sensitivity D(Beta)/D(Mean) is
the change rate of ‘reliability index’.
(a) In case that ‘Mean point’ is in failure zone
(b) In case of ‘Mean point is in safe zone
Figure 3 Graphical representation of D(Beta)/D(Mean)
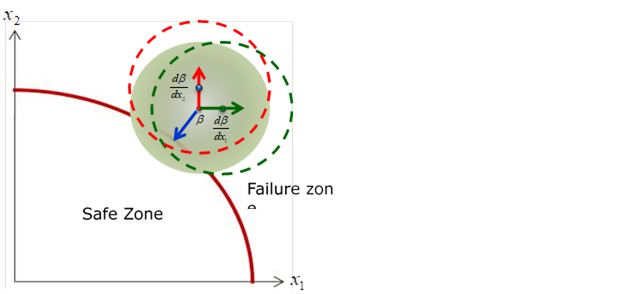
(a) In case that ‘Mean point’ is in failure zone

(b) In case of ‘Mean point is in safe zone
Figure 4 Graphical representation of D(Beta)/D(STDV)
Figure 4 shows the graphical representation of
D(Beta)/D(STDV). This represents the change rate of reliability index when the
standard deviation  is
increase by
is
increase by 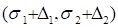 .
.
Similarly, the values of D(P)/D(Mean) and D(P)/D(STDV) represent the change rate of failure probability when the mean value moves and the standard deviation is increased. These design sensitivity information is used to estimate the ‘reliability index’ and ‘failure probability’.
By substituting the analysis results shown in Figure 4, the failure probability can be estimated by using the follow approximation form.
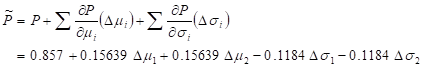
In order to help one’s understand, we solve the reliability
analysis problem shown in Figure 5. The mean value lies in safe zone. Also,  and
and  are different values.
Figure 5 Reliability analysis in case that ‘mean value’ lies in safe zone.
Figure 6 shows the summary sheet of reliability analysis
results. The failure probability is 1.09(%). The design sensitivity information
explains that DP2 ( )is more
sensitive to failure than DP1.
)is more
sensitive to failure than DP1.
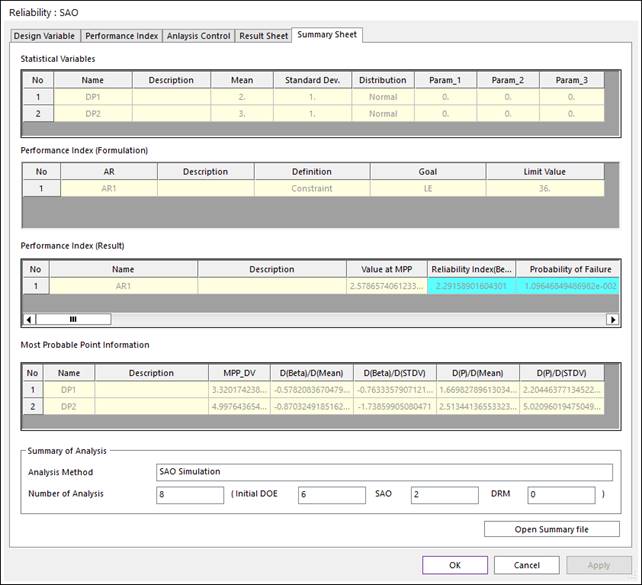
Figure 6 Summary Sheet of the reliability analysis problem shown in Figure 3