You can change Chart Settings.
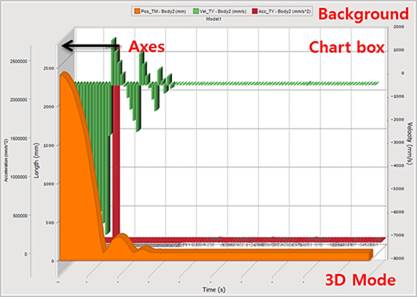
Figure 1 General Settings of Chart
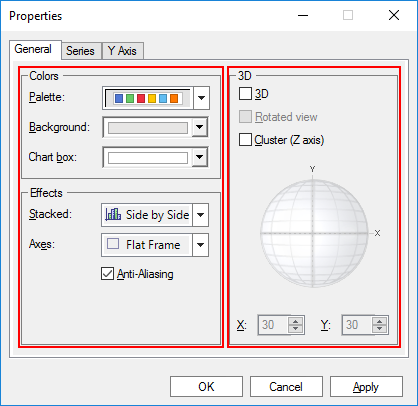
Figure 2 General tab of the Chart Properties dialog box
Colors Settings
•Palette: Essentially, Palettes are a group of colors that apply to the different elements in the chart. When a palette is changed, all the elements that have not been forced to have a specific color will adapt to the new palette.
•Background: Changes the background color outside the Chart box.
•Chart box: Changes the background color inside the Chart box.
Effects Settings
•Stacked: Stacked options apply only to Bar and Area charts. So before applying this property, you must make sure the previous series and the selected series are of the same type (Bar or Area).
•Side by Side
•Stacked
•Stacked 100%
•Axes: Sets the axes style.
•None: No frame is displayed around the axis.
•3D Frame: A 3D frame will be shown as the axis.
•Math: Only tickmarks will be shown as the axis.
•Flat Frame: A single, flat frame is displayed in the axis.
•Anti-Aliasing: Antialiasing is a technique for diminishing jagging (stair step) like lines that should be smooth.
•Rotated view: Rotates around X or Y Axis to specific angles and perspectives. This property can only be used when the chart is in 3D view. To avoid jagged lines, we recommend you use prominent angles (for example: 0,30,45,60,90, etc).
•Cluster(Z axis): Displays a z-clustered 3D chart. When setting this property, you must make sure the chart is displayed in 3D mode and that the chart is cluster capable (BAR or LINES chart).