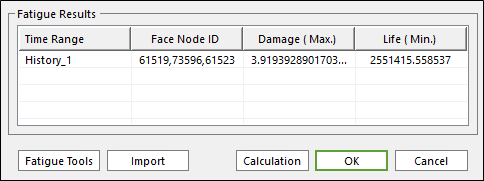
Fatigue Tools supports two types of functions, Rainflow Counting and Plot History, it is located in the bottom of the Fatigue Evaluation dialog as in the Figure 1. The Rainflow Counting results can be shown in an Excel spreadsheet as a 3D chart with the stress/strain range, the mean stress/strain and the number of cycles. And, Plot History shows the raw stress/strain time history on one patch after performing the tensor transformation about all the defined patches. The button for Fatigue Tools is available after evaluating the fatigue results as shown blow.
Figure 1 Fatigue Tools in the Fatigue Evaluation dialog
Rainflow Counting
The rainflow counting results can be shown in an Excel spreadsheet automatically by clicking Rainflow Counting in Fatigue Tools dialog as shown in the Figure 2 below.
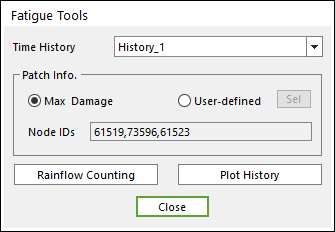
Figure 2 The Rainflow Counting in the Fatigue Tools dialog
In the Excel spreadsheet, it is possible for user to see easily the stress/strain range, the mean stress/strain and the number of cycles from the defined time history a 3D chart. In addition, the raw data to draw the chart can be shown like the Figure 3.
It is possible to select the user-defined patch by clicking Sel, and then to see the results by clicking Rainflow Counting. At that time, the section of Node IDs shows the information about nodes ID number composing the used-defined patch or the patch with the maximum damage.
If the multi-time history sets are defined on Time History of the Fatigue Evaluation dialog, it is possible to see the Rainflow Counting results on the patch according to each time set by selecting a time set in Time History of the Fatigue Tools dialog.

Figure 3 The Rainflow Counting results in a 3D chart
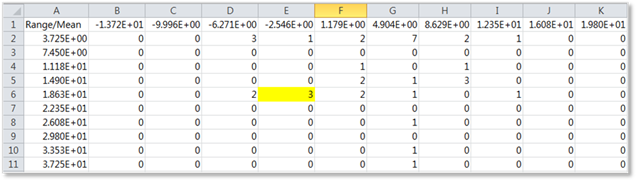
Figure 4 The raw data to draw a 3D chart
In Figure 4, the value in each cell means the average value of the interval of the Range stress/strain or the Mean stress/strain.
In other words, if the interval between every cell is 3.725 in the table in Figure 4, every value in each cell means as follows.
Each value – 3.725/2 =< Each value < Each value + 3.725/2
Therefore, the meaning of 3 in the yellow cell in Figure 5 is the total cycles about all cases with the following conditions.
18.625 – (3.725/2) <= the Range of stress < 18.625 + (3.725/2)
-2.546 – (3.725/2) <= the Means stress < -2.546 + (3.725/2)
Note
The Rainflow Counting function can be supported the Excel 2010 version and the later version.
Plot History
Plot History shows the raw stress/strain time history on the patch with the maximum damage after performing the tensor transformation about all the defined the patch set or the element set. The time history can be shown by clicking Plot History in Fatigue Tools dialog as shown in the Figure 5 below. After that, the plot results show as like the Figure 6.
Figure 5 The Plot History in the Fatigue Tools dialog
In addition, it is possible to select the user-defined patch by clicking Sel, and then to see the time history by clicking Plot History. At that time, the section of Node IDs shows the information about nodes ID number composing the patch.
If the multi-time history sets are defined on Time History of the Fatigue Evaluation dialog, it is possible to see the raw stress/strain time history on the patch according to each time set by selecting a time set in Time History of the Fatigue Tools dialog.
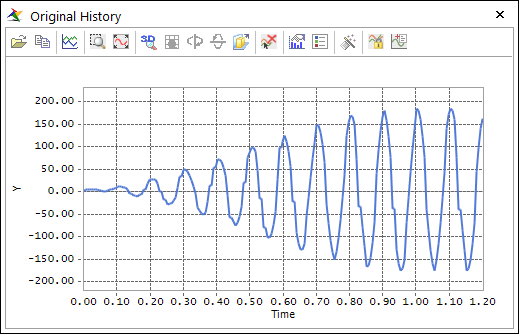
Figure 6 The Original History results
For reference, the Original History results that consist of the stress or strain results based on time is generally used for performing Rainflow Counting. So, if you want to check the Rainflow Counting results or to validate the fatigue results, this plot results will help you to understand.