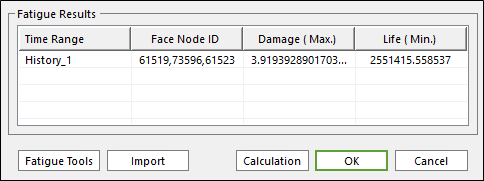
Figure 1 Fatigue Results of the Fatigue Evaluation dialog
If the user clicks Calculation to evaluate the fatigue results, RecurDyn/Durability reports the results in the Fatigue Results box. If the user selects the Stress-based or Strain-based life criteria, the user can see the maximum damage and minimum life for the worst face ID. If the user selects the Safety Factor, the user can check the safety factor for the worst face ID. The user can also check the fatigue analysis result via contour plots.
For reference, the damage of one cycle is determined by the mean stress and amplitude of the loading cycle, and it’s not affected by the previous cycles and existing damage. By checking the S-N Curves, the fatigue life (in terms of the number of cycles) of each identified cyclic loading is determined and can be used to calculate the damages as in the following.
•For each cyclic loading cycle: 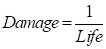
•For  times of repeated cycles:
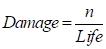
Where,
 : the number of cycles
calculated by the rainflow counting from the time history.
: the number of cycles
calculated by the rainflow counting from the time history.
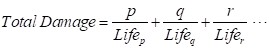
After experiencing multiple cyclic loading cycles of
 for
for  times,
 for
for  times,
 for
for  times and so on
the cumulative damage value is calculated by
Where,
 : the mean stress
 : the stress amplitude
At that time, the fatigue results box shows the maximum damage with the node IDs which represent the element free face.
And then, the minimum fatigue life is as shown below.
In case of the safety factor, this shows just the minimum safety factor with the node with the node IDs which represent the element free face.