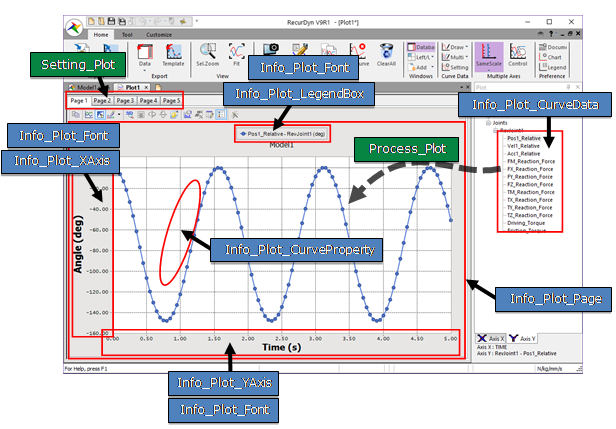
When the user uses Plot Automation, in order to apply various chart effects, the user should control the chart properties. So, eTemplate Plot Automation supports to set various chart effects.

Parameters for drawing plot curve
•Info_Plot_CurveData: Information parameter to define the plot curve data.
•Info_Plot_CurveProperty: Information parameter to define the curve properties(Line style, Color, …).
•Info_Plot_XAxis: Information parameter to define the X-Axis properties(Min, Max, Grid, Color, …).
•Info_Plot_YAxis: Information parameter to define the Y-Axis properties(Min, Max, Grid, AxisPosition, Color, …).
•Info_Plot_LegendBox: Information parameter to define the legend box properties(DockedPosition, Font, …).
•Info_Plot_Page: Information parameter to define the page properties(BackGroundColor).
•Info_Plot_Font: Information parameter to define the font properties(Type,Size, …).
•Setting_Plot: Defines the number of pages and plot axis type. The default value of plot axis type is SameScale.
•SameScale: Y-Axis is the same automatically.
•NewAxis: All Y-Axis is created independently.
•Process_Plot: Defines the curve to be drawn in the plot and defines whether drawing process will run or not.