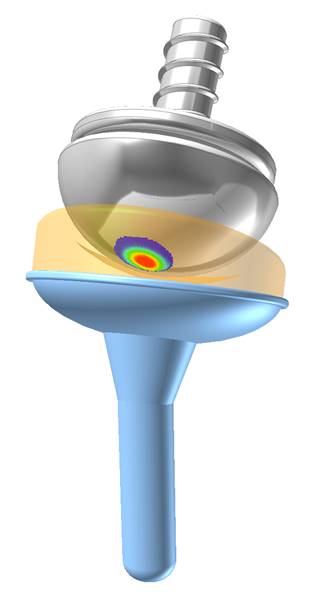
This tool enables the contour display for some outputs like contact pressure that occurs to the rigid body.
Figure 1 Contour Display
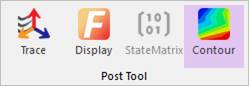
Figure 2 Contour icon of the Post Tool group in the Analysis tab
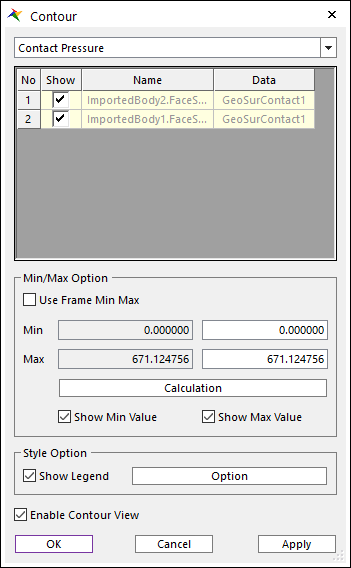
Figure 3 Contour dialog box
•Contour Type: Selects the type of contour to display.
•Contour List: The list of contour the user can display.
•Show: The user can draw contour for the checked list. And Min/Max is also calculated for the checked list.
•Name: The name of the patch to draw the contour. If the user clicks it, the patch is highlighted on Working Window.
•Data: The name of the entity which generated the contour data.
•Use Frame Min Max: If this option is on, contour display uses the minimum and maximum values for each frame, not total.
•Min/Max: The calculated total minimum or maximum values can be displayed at first edit box, and the user can choose the appropriate value at second edit box.
•Calculation: Calculates the total minimum and maximum values.
•Show Min Value / Show Max Value: If this option is on, the position which has the minimum or maximum values is displayed on Working Window.
•Show Legend: If this option is on, the legend of this contour is displayed on Working Window.
•Option: Opens the Legend Option dialog, and the user can modify the legend options with it.
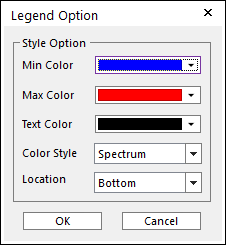
Figure 4 Legend Option Dialog box
•Min Color: Sets the color for min value.
•Max Color: Sets the color for max value.
•Text Color: Sets the color for text.
•Color Style: Selects a type to full colors in the contours. The default is Spectrum. In the Gray Scale type, only gray colors are used.
•Location: Indicates the position of legend. The default is Bottom.
•Enable Contour View: If this option is on, the contour is displayed.