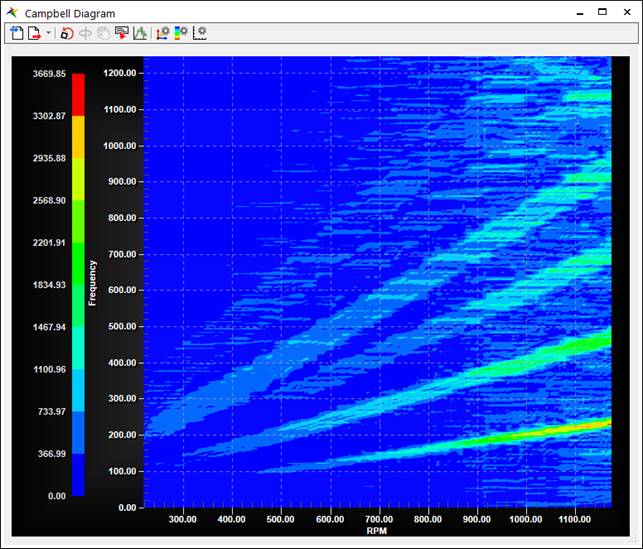
Figure 1 Color Map
Toolbar
Color Map toolbar support various features.
•Import File: It is used to import 3D data file (*.csv). Usually exported from its dialog.
•Export Files: It is used to export 3D data file (*.csv).
•Export Image (Clipboard): It is used to copy an image of color map to the clipboard.
•Export Image (Setting): It is used to make image file of color map.
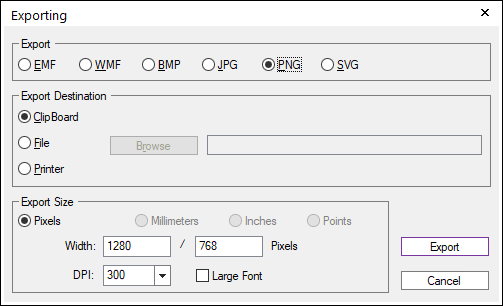
Figure 2 Export Image
•Initialize View (F): It initialize the view status such as zoom.
•Trace Data: It traces the RPM, Frequency, Magnitude data from the location of mouse pointer.
•Section View: It enables the section view of X and Y-Axis and section view option. With Trace Data option toggled, clicking the color map updates the X, Y-sections.
•Show Section Lines: It specifies whether to toggle the section line.
•Zoom: It specifies the mouse operation in section view plot. Dragging in the section view plot operates as Zoom.
•Data Trace: It specifies the mouse operation in section view plot. It traces the data from the location of mouse pointer.
•Fit: It initialize the view status such as zoom.
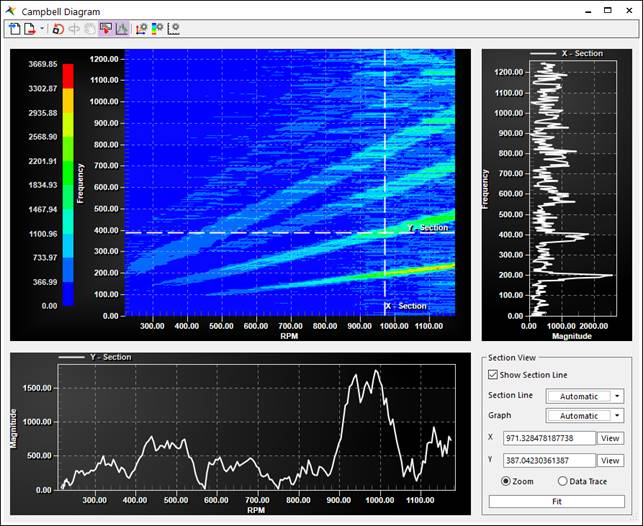
Figure 3 Section View
Note
Clicking the mouse right-click on Color Map or Section View will show the pop-up menu. In Color Map, it supports Viewing Style and Plotting Method. In Section View, it supports Viewing Style, Plotting Method, Mark Data Points and Add to Plot.
•Axes Setting: It specifies the settings of X, Y and Z-Axes. In case of Color Map, Z-Axis cannot be modified.
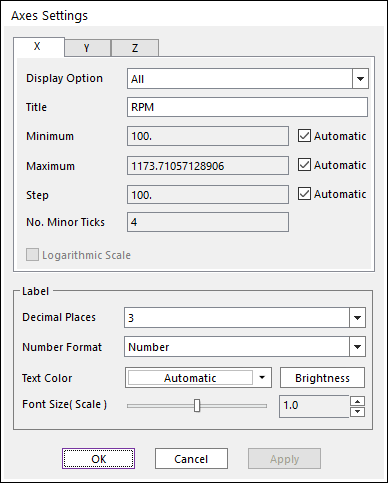
Figure 4 Axes Settings dialog box
•Display Option: It specifies how to display the axis data. It supports All, Grid Lines and Axis Title, Grid Lines and Grid Numbers, Grid Only, Axis Title Only, None.
•Title: It is used to change the title of axis.
•Minimum: It specifies the minimum value of axis. To customize its value, uncheck the Automatic option.
•Maximum: It specifies the maximum value of axis. To customize its value, uncheck the Automatic option.
•Step: It specifies the step of the grid line of axis. To customize its value, uncheck the Automatic option.
•No. of Minor Ticks: It specifies the number of ticks between the steps. Unchecking the Automatic option in Step activates this option.
•Logarithmic Scale: It specifies whether to use Logarithmic scale. It can be activated in Z-Axis which is magnitude of the graph.
•Decimal Places: It specifies the decimal places of axes. It supports decimal places of 1 ~ 7.
•Number Format: It specifies the number format of axes. It supports the Number and Scientific.
•Text Color: It specifies the text color of axes.
•Brightness: It specifies the brightness of text of axes. It supports numbers between 0 ~ 255 (brightest).
•Font Size (Scale): It specifies the font size of axes.
•Contour Legend
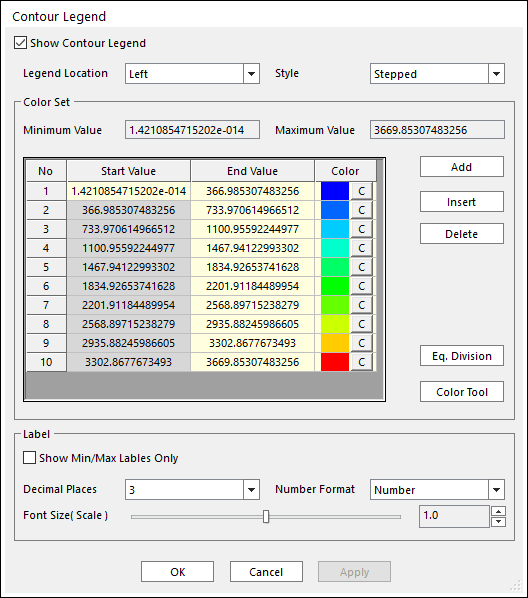
Figure 6 Contour Legend dialog box
•Show Contour Legend: It specifies whether to show contour legend.
•Legend Location: It specifies the location of legend. It supports top, bottom, left and right.
•Style: It specifies the style of contour. It supports stepped or smooth.
•Eq. Division: It is used to automatically distribute values evenly according to the number of rows.
•Color Tool: It is used to set the minimum and maximum color and values of contour.
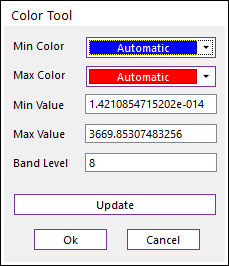
Figure 5 Color Tool
•Setting
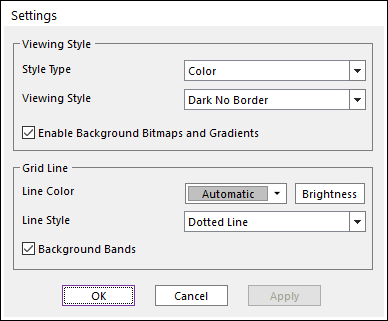
Figure 7 Settings dialog box
•Style Type: It specifies the style type of color map. It supports Color, Monochrome, Monochrome + Symbol.
•Viewing Style: It specifies the viewing style of color map. It supports Light Inset, Light Shadow, Light Line, Light No Border, Medium Inset, Medium Shadow, Medium Line, Medium No Border, Dark Inset, Dark Shadow, Dark Line, Dark No Border
•Enable Background Bitmaps and Gradients: It specifies whether to enable background bitmaps and gradients.
•Line Color: It specifies the color of grid lines.
•Line Style: It specifies the style of grid lines. It supports Thin Solid Lines, Thick Solid Line, Dotted Line, Dashed Line.
•Background Bands: It specifies whether to use background bands. It sets slightly dark area in grid steps alternately.