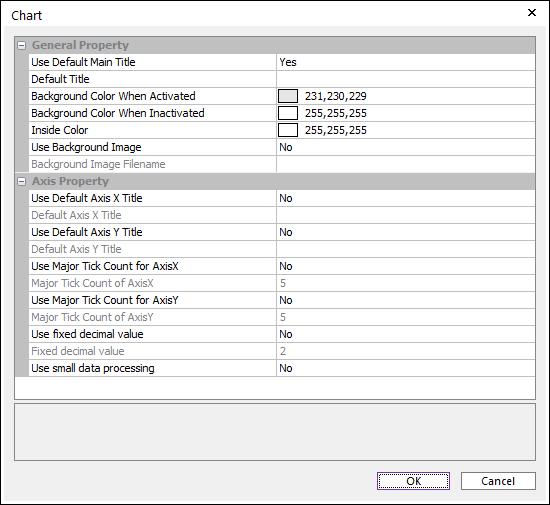
Figure 1 Chart Settings dialog box
General Property
•Use Default Main Title: Use the default title by selecting Yes. (The default option is Yes.)
•If it is Yes, the default title is set with Main Title. If Main Title is empty, default title will be the name of the root of the database tree.
•If it is No, the main title is not set.
•Default Title: The string of the default title.
•Background Color When Activated: Changes the background color when Plot Window is activated.
•Background Color When Inactivated: Changes the background color when Plot Window is inactivated.
•Inside Color: Changes the inside color of Plot Window
•Use Background Image: Selects Yes or No. If the user wants to use an image as the background, select Yes. (The default option is No.)
•Background Image Filename: If Use Background Image is Yes, the user should enter the filename.
Axis Property
•Use Default Axis X Title: Use the default Axis X Title by selecting Yes. (The default option is No.)
•If it is Yes, Axis X Title is set with Axis X Title.
•If it is No, Axis X Title is Time.
•Use Default Axis Y Title: Use the default Axis Y Title by selecting Yes. (The default option is No.)
•If it is Yes, Axis Y Title is set with Axis Y Title.
•If it is No, Axis Y Title is the unit of desired data.
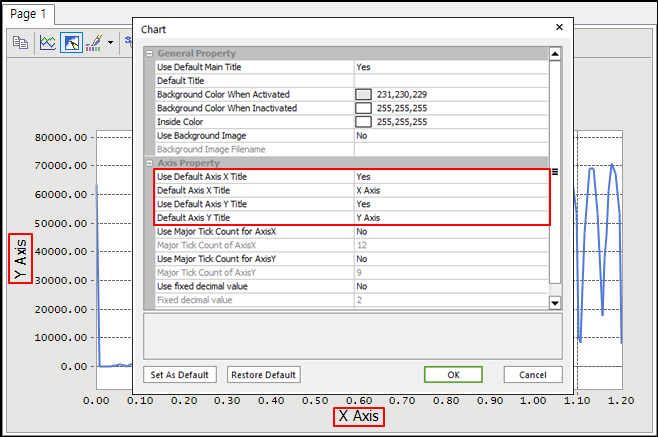
Figure 2 Use Default Axis X Title & Use Default Axis X Title [No]
•Use Major Tick Count for AxisX
•If it is Yes, the major grid for axis X is controlled by number of Major Tick Count for AxisX.
•If it is No, the major grid for axis X is set automatically. The displayed numbers in an axis are that the rest except the two-digit of significant figures are set to zero. (The default option is No.)
•Major Tick Count for AxisX: Changes the number of major gird for Axis X.
•Use Major Tick Count for AxisY
•If it is Yes, the major grid for axis Y is controlled by number of Major Tick Count for AxisY.
•If it is No, the major grid for axis Y is set automatically. The displayed numbers in axis are that the rest except the two-digit of significant figures are set to zero (The default option is No.)
•Major Tick Count of AxisY: Changes the number of major gird for Axis Y.
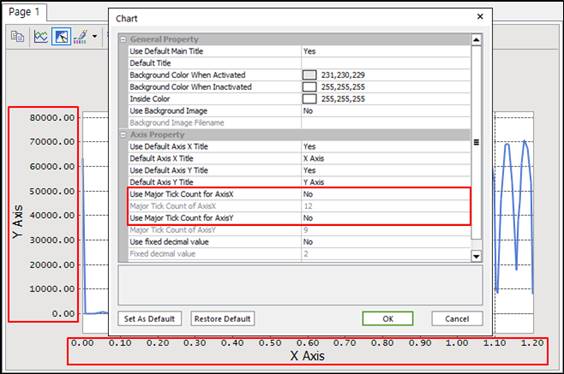
Figure 3 Use Major Tick Count for Axis X & Use Major Tick Count for Axis Y [No]
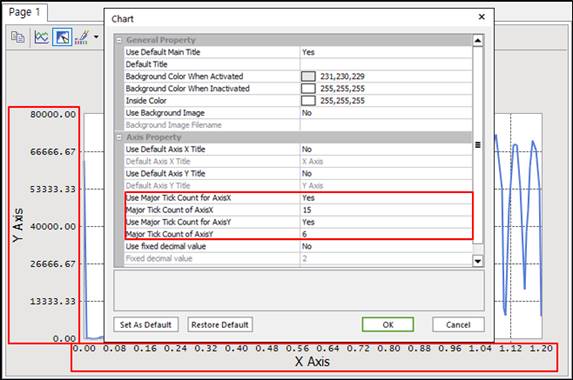
Figure 4 Use Major Tick Count for Axis X & Use Major Tick Count for Axis Y [Yes]
•Use fixed decimal value
•If it is Yes, decimal values of axis X and Y are fixed as Fixed decimal value. So, it is useful that the user does not want to change the decimal value, regardless of plot data.
•If it is No, decimal values of axis X and Y are set automatically as a step value. (The default option is No.)
•Fixed decimal value: Changes decimal values of axis X and Y.
•Use small data processing
•If it is Yes, the Minimum value is set as 0.5 and the Maximum value is set as -0.5 automatically when plot data are less than 10e-5. (The default option is Yes.)
•If it is No, it is possible to fit the small plot data which are less than 10e-5. The maximum significant digits is 10e-13.
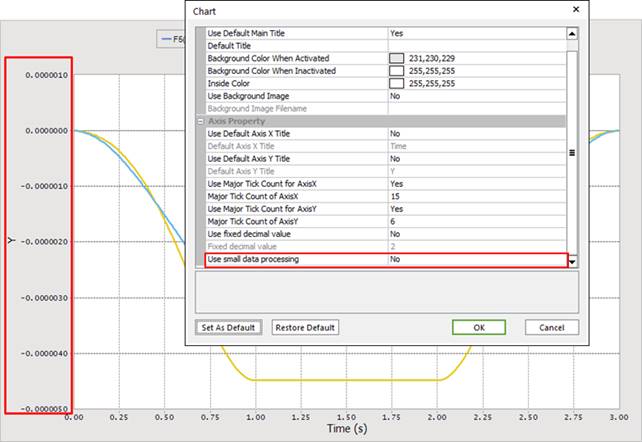
Figure 5 Use small data processing [No]
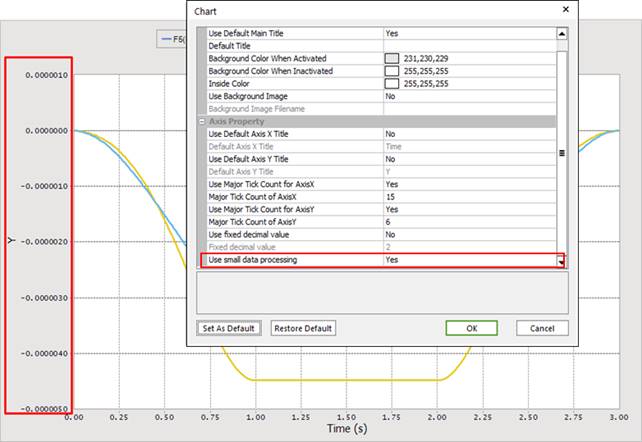
Figure 6 Use small data processing [Yes]