The user can change an axis position or a pane. The user must draw plot data before using this function.
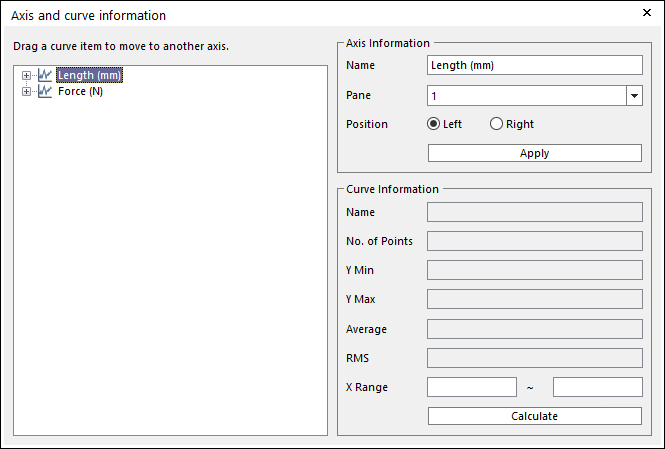
Figure 1 Axis and curve information
Step to move curve from its own axis to another
1. Select the curve item you want to move.
2. Drag the item to target axis and drop.
3. If you drop to empty space of tree control, the chart will create an axis and move curve to the new one.
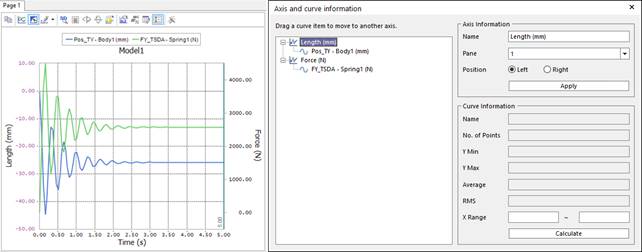
Figure 2 Combining two curves to one axis by Drag & Drop function
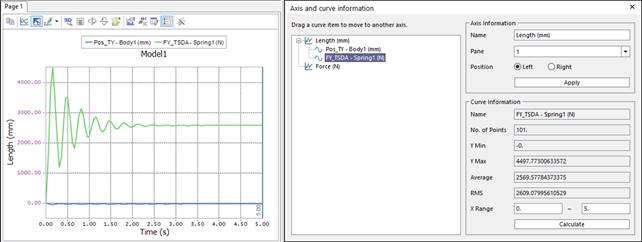
Figure 3 Dividing curves to different axes by Drag & Drop function
Step to calculate the average and rms value of specific range
1. Select the curve item, then you can see curve’s information.
2. Input the time range you want to calculate to ‘X Range’ edit.
3. Click Calculate, then you can see the result.
Step to edit Axis Settings
1. Select the Axis item, then you can see axis’s information.
2. Change the name, select a Pane, or select the Position option as Left or Right.
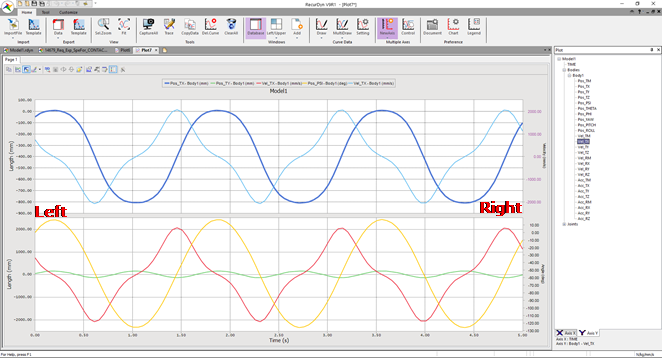
Figure 4 Display Position
3. To apply the change, click Apply.